Grey Matter Report Reveals 21% Surge in B2B Non-Brand Google Ads Cost-Per-Click Amid Evolving Automated Bidding Dynamics

New industry research released in October by digital marketing agency Grey Matter indicates that non-branded Google Ads keywords for business-to-business (B2B) advertisers experienced an average cost-per-click (CPC) increase of approximately 21% between April and September compared to the same period in the previous year. The study, which isolates specific variable changes including ad position, Quality Score, and total campaign spend, highlights the shifting economics of paid search for B2B enterprises navigating increasingly competitive digital auctions.
The findings arrive at a time when digital marketing budgets face rigorous corporate scrutiny. While standard industry benchmarks typically present aggregate, macroeconomic averages that bundle together broad match queries, brand terms, and distinct campaign types, Grey Matter’s report zeroes in on a controlled subset of 1,349 distinct non-brand keywords tracked consistently across 14 dedicated B2B client accounts. By holding the specific keywords and accounts constant over six distinct quarters running from April 2025 through September 2026, the agency sought to distinguish between broader market inflation and the consequences of individual advertiser behavior.
Methodological Framework and Research Chronology
The empirical foundation of the report spans an extended observation window starting in the second quarter of 2025 and culminating at the end of the third quarter of 2026. Analysts at Grey Matter specifically isolated year-over-year performance for the months of April through September. To ensure analytical integrity, the research team implemented strict exclusion criteria. Broad match keywords were entirely omitted from the primary dataset because the specific queries they trigger naturally fluctuate over time. Similarly, keywords associated with Maximize Clicks campaigns, along with all brand-specific and competitor-specific search terms, were removed from the headline estimate.
Andy Hendricks, Grey Matter’s head of search, spearheaded the initiative to decouple macro market pressures from micro-level strategic decisions made by individual marketing teams. Most published CPC benchmarks fail to account for this critical differentiation, offering instead a generalized average that masks underlying auction dynamics.
To derive the headline 21% figure, the agency utilized a rigorous regression model incorporating data from all 14 participating B2B accounts. This model actively controlled for four primary variables: campaign spend, impression share lost due to budget constraints, top-of-page ad positioning, and Quality Score. Every advertiser in the sample was weighted equally, regardless of absolute budget size, preventing massive enterprise accounts from skewing the aggregated results.
When analyzing the data without any statistical controls applied, the raw year-over-year cost for the exact same keywords surged by 29%. Introducing spend-related controls lowered that figure to 22%, while further accounting for ad position and Quality Score brought the final adjusted market increase to 21%, with a statistically calculated likely range spanning from 1% to 44%.
The Role of Increased Spending and Automated Bidding
One of the most notable insights generated by Grey Matter’s regression analysis is the direct quantitative relationship between escalating campaign budgets and rising cost-per-click metrics. According to the data, every 10% increase in campaign spend correlates with approximately a 1.4% increase in CPC, entirely separate from broader market inflation. Consequently, an advertiser that doubles its overall search budget can statistically expect an approximate 11% increase in its baseline cost per click for the exact same keywords.
This phenomenon was vividly demonstrated by an extreme outlier within the study’s sample. One participating advertiser nearly quadrupled its non-brand search budget year over year, resulting in a staggering 132% surge in its same-keyword CPCs. Interestingly, the same advertiser maintained a flat budget for its brand-specific keywords during the same timeframe, which experienced a modest and expected 4% CPC increase in the third quarter.
Industry experts attribute this direct correlation primarily to the widespread adoption and operational mechanics of modern automated bidding strategies. When a campaign utilizes algorithmic frameworks such as Maximize Conversions or Target CPA, the underlying bidding system actively seeks out new conversion opportunities by aggressively entering auctions it previously avoided. This operational shift frequently pushes the campaign into higher ad positions, more intense competitive landscapes, and pricier times of day, thereby driving up the blended and individual click costs.
A Closer Look at the Keyword Price Index
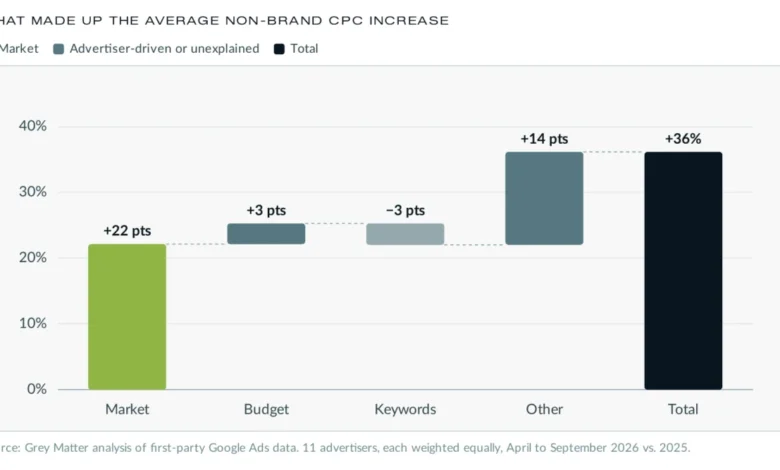
To further validate the findings, Grey Matter implemented a secondary estimation technique via a keyword price index, which focused specifically on 11 advertisers possessing a sufficient volume of matching keywords from quarter to quarter. For this specific cohort, the overall year-over-year increase in average non-brand CPC reached a substantial 36%.
A granular breakdown of this 36% overall surge reveals the multi-faceted nature of modern search inflation:

- Market Inflation: 22 percentage points of the increase were directly attributed to broader market competitiveness and baseline cost escalation.
- Increased Spending: An additional 3 percentage points were traced directly to aggressive budget expansions by the advertisers.
- Strategic Adjustments: A mitigating 3-percentage-point deduction was observed due to various deliberate shifts in keyword selection, match types, and bid strategies.
- Unexplained Variance: The remaining 14 percentage points could not be accounted for by the first three analytical categories.
The report notes that the majority of these 14 unexplained points were heavily concentrated within a small subset of advertisers who saw their individual CPCs effectively double. Researchers suggest this sharp escalation reflects hyper-competitive dynamics within specific B2B product and service categories. Across the entire cohort of 11 indexed advertisers, actual CPC changes varied dramatically, ranging from a 30% decrease to a 121% increase. Ten of the eleven accounts paid more for the exact same keywords, and nine experienced higher overall average CPCs.
Notably, one advertiser maintained a completely flat spending level yet still witnessed a 20% increase in the cost of its core non-brand keywords. After shifting a portion of its fixed budget toward more expensive phrase-match keywords, that same advertiser’s overall average CPC escalated by 40%.
Nuances, Limitations, and Broader Industry Context
Because the sample size is limited to 14 B2B accounts managed by a single agency, Grey Matter acknowledges that the confidence intervals surrounding its metrics are wide. When the single largest spender is removed from the dataset, the primary CPC increase estimate drops from 21% to approximately 17%, with a broader likely range of -2% to 40% that technically includes zero. Conversely, if broad match keywords are factored back into the regression model, the estimated year-over-year increase climbs to roughly 31%.
Hendricks emphasizes that while the data points toward a most-likely cost increase of around 20% for identical clicks, the true figure for any individual enterprise could fluctuate significantly based on micro-verticals and regional targeting. Furthermore, the report explicitly frames its findings in terms of statistical correlation rather than definitive causation. The published documentation does not disclose the specific geographic markets, currencies, or individual industry sectors of the participating businesses.
Crucially, the study intentionally omits conversion rate and cost-per-lead (CPL) data. Consequently, the research cannot definitively ascertain whether the advertisers experiencing escalating CPCs secured superior or inferior financial returns as a result. This limitation touches on an ongoing debate within the digital marketing community. In an analysis published earlier in the year on Search Engine Journal, digital marketing consultant Jyll Saskin Gales argued that under modern Smart Bidding paradigms, a high cost per click is frequently an indicator of a healthy, aggressive account rather than an operational failure. Gales noted that campaigns must ultimately be evaluated through bottom-line metrics such as Customer Acquisition Cost (CAC) and Return on Ad Spend (ROAS) rather than isolated top-of-funnel cost metrics.
Divergence From Alphabet’s Macro Financial Reports
To place these agency-level findings in a broader economic perspective, it is instructive to examine official financial data released by Google’s parent company, Alphabet. In its Form 10-Q filing for the third quarter of 2026, Alphabet reported that cost-per-click across Google Search and associated properties rose by 4% year over year.
Alphabet defines its internal CPC metric as total click-driven revenue divided by the aggregate number of paid clicks. This corporate metric is influenced by a multitude of macroeconomic variables, including shifts in user device preferences, geographic market expansion, enterprise advertising expenditure fluctuations, and an evolving product mix across Google’s vast network. Because Alphabet’s metric aggregates all paid clicks across consumer and commercial properties globally, it tracks both the shifting price of individual auctions and the changing composition of the click stream.
In contrast, Grey Matter’s analysis maintains constant parameters by tracking identical keywords within specific B2B accounts. Because the two methodologies measure fundamentally different phenomena, industry analysts note that they neither directly confirm nor contradict one another, serving instead to illustrate the vast gap between macro-level corporate financial disclosures and micro-level agency campaign realities.
Strategic Implications and Recommendations for 2027 Budgets
For B2B marketing leaders and paid search practitioners, the Grey Matter report serves as an essential reference point rather than a rigid forecasting model. The data demonstrates that raw CPC averages can climb not only because market rates are rising, but also because advertisers are actively pursuing more expensive, higher-intent auction inventory.
Digital marketing professionals seeking to audit their own accounts are encouraged to compare the year-over-year cost inflation of their static non-brand keyword sets against the movement of their account-wide average CPC. Analyzing the delta between these two figures can reveal the precise financial impact of internal adjustments regarding match types, keyword expansion, and automated bidding strategies.
Looking forward toward planning cycles for 2027, the agency’s primary strategic guidance centers on controlled pacing. Marketers are advised to scale campaign budgets gradually, evaluating each incremental financial commitment against the marginal cost of the newly acquired clicks. For accounts heavily reliant on automated bidding models such as Maximize Conversions, search strategists recommend establishing a clear internal valuation of additional conversion events before authorizing budget expansions, ensuring that automated algorithms do not inadvertently drive up marginal acquisition costs beyond sustainable economic thresholds.