The Ultimate Guide to Social Media Dashboards: Centralizing Metrics for Strategic Growth

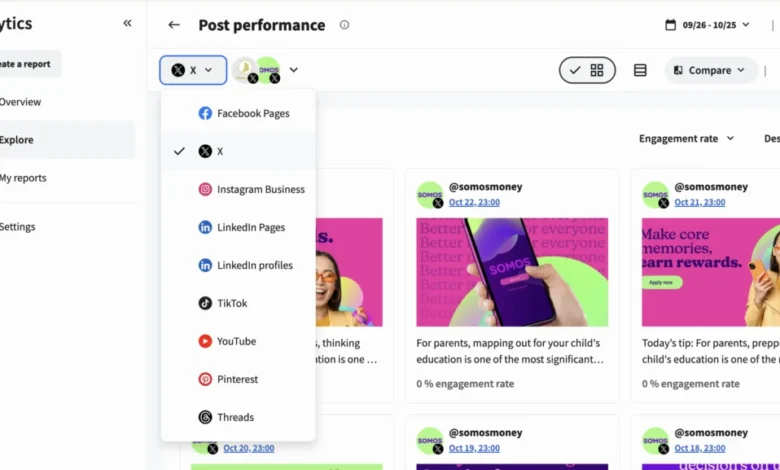
In an era where global social media advertising expenditure is projected to surpass $121 billion in 2026, the ability to synthesize fragmented data into actionable intelligence has become a core competency for enterprise-level marketing organizations. A social media dashboard serves as the central nervous system for these operations, consolidating disparate performance metrics from platforms such as Instagram, LinkedIn, Facebook, TikTok, and X into a unified, coherent interface. By replacing the inefficient practice of manual, platform-by-platform data extraction with automated, real-time visualization, organizations can pivot from reactive reporting to predictive strategic planning.

The Evolution of Social Media Analytics
Historically, social media marketing was characterized by "vanity metrics"—likes, shares, and follower counts that offered little insight into bottom-line business objectives. As marketing budgets have faced scrutiny, with recent surveys indicating that CMOs currently allocate approximately 7.8% of overall revenue to marketing activities, the mandate for accountability has intensified. Today’s dashboards have evolved into sophisticated systems that integrate cross-platform analytics with CRM and sales data. This transformation allows teams to bridge the gap between social engagement and tangible business outcomes, such as qualified leads, conversion rates, and total return on ad spend (ROAS).
Taxonomy of Dashboard Architecture
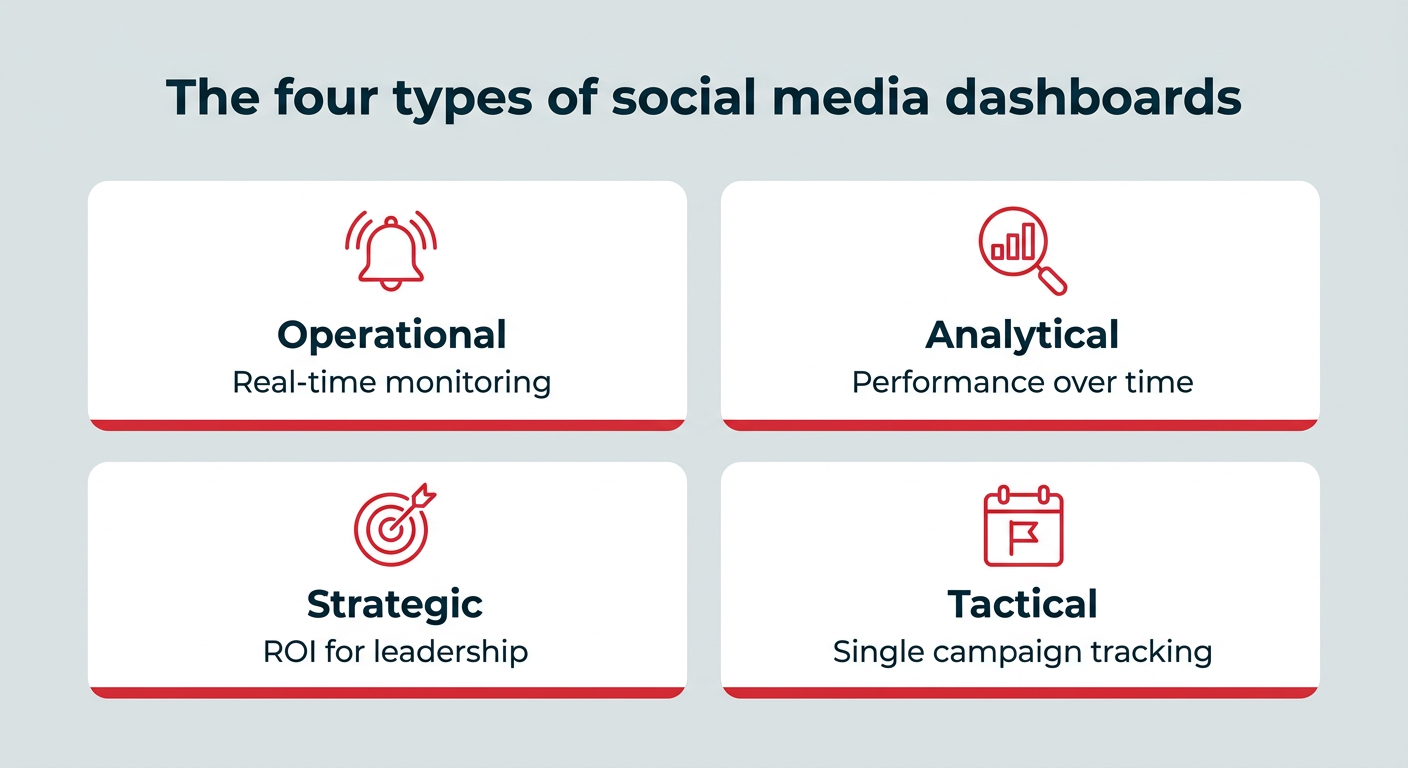
To maximize the efficacy of data visualization, industry experts categorize social media dashboards into four distinct functional pillars. Each type is designed to serve a specific stakeholder group and operational requirement:
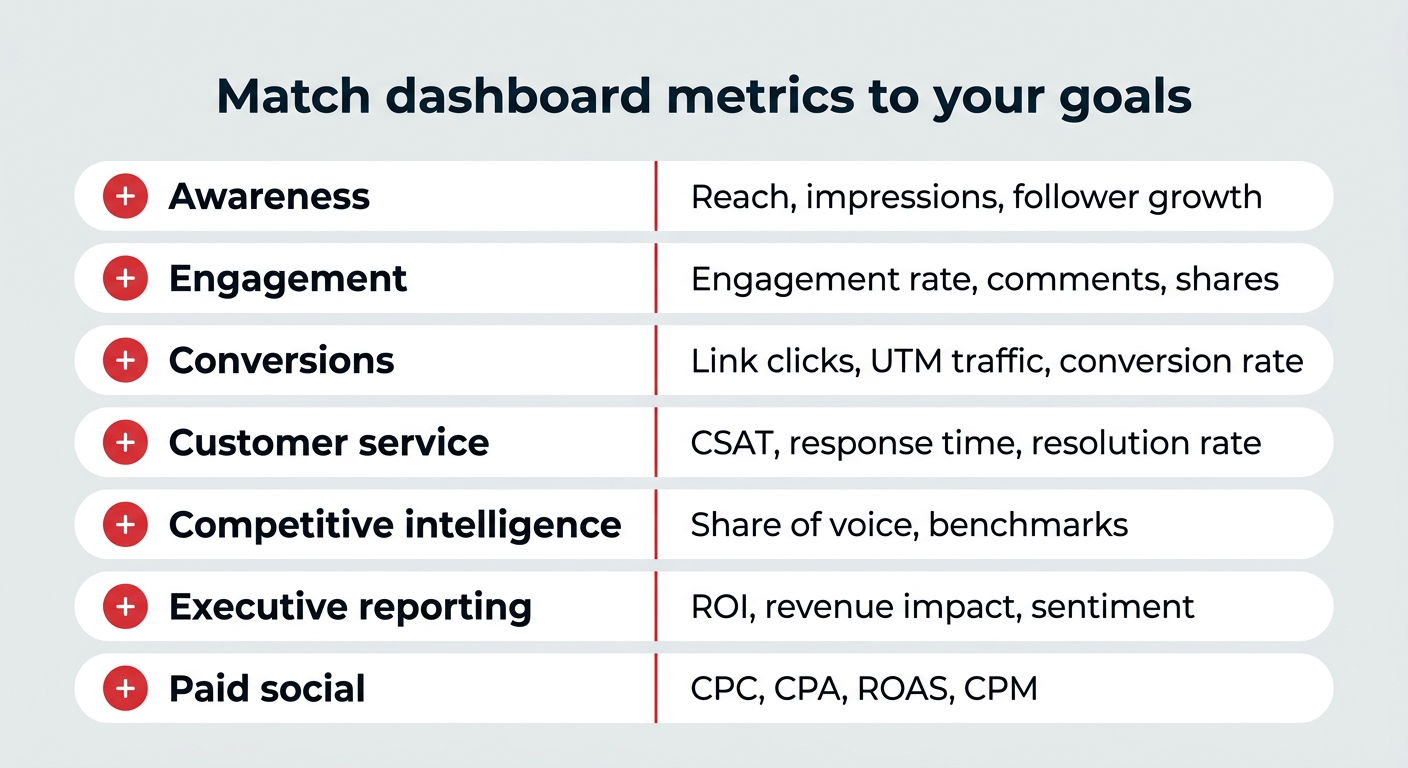
- Operational Dashboards: These are utilized primarily by community management and customer care teams. They prioritize real-time data, tracking response times, resolution rates, and incoming mentions. The objective is to maintain service-level agreements (SLAs) and protect brand reputation during live events.
- Analytical Dashboards: These serve as the primary tool for social media managers and data analysts. By focusing on longitudinal data, these dashboards track content performance, audience demographics, and growth trends over weeks or months. This is where long-term strategy is refined based on content efficacy.
- Strategic Dashboards: Designed for the C-suite and VPs of Marketing, these focus on high-level KPIs. They prioritize ROI, market share, and progress toward annual business objectives. The emphasis here is on the "big picture"—how social media contributes to the company’s broader financial health.
- Tactical Dashboards: These are project-based interfaces created to track the lifecycle of a specific campaign. From launch to post-mortem, these dashboards provide paid social specialists with the granular data necessary to optimize bidding strategies and creative assets in real-time.
Data-Driven Decision Making: The Strategic Imperative
The cost of inaction in the current digital landscape is significant. Without a centralized dashboard, teams often struggle with data silos, leading to delayed decision-making. When performance data is scattered across native analytics tools, teams lose the ability to detect emerging trends before they fade.

Modern dashboards leverage AI-powered insights to surface anomalies—such as a sudden spike in negative sentiment or an unexpected viral post—that would otherwise be buried in spreadsheets. This capability is essential for large-scale operations managing dozens of accounts, where manual reporting can consume dozens of hours per month. By automating the reporting process, teams regain valuable time to focus on creative strategy and high-level execution.
Mapping Metrics to Business Goals
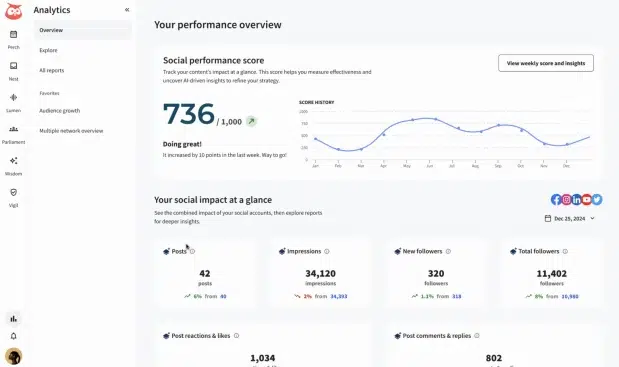
The effectiveness of a dashboard is determined by the alignment between the metrics tracked and the overarching business goal. A common pitfall is "dashboard clutter," where teams track irrelevant data simply because it is available. Best-in-class organizations follow a strict framework for metric selection:
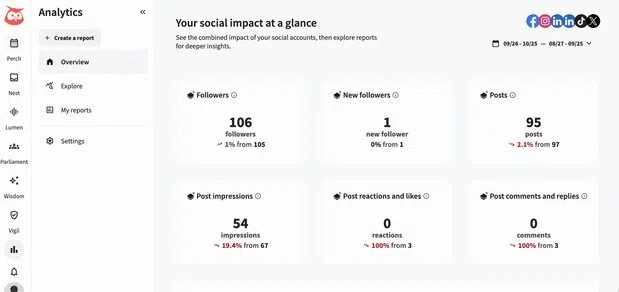
- For Awareness: Focus on reach, impressions, and audience growth rates.
- For Engagement: Track engagement rates, sentiment analysis, and interaction volume to gauge brand resonance.
- For Conversions: Monitor UTM-tracked traffic, click-through rates (CTR), and direct attribution to sales funnels.
- For Customer Service: Measure response time, resolution rate, and Customer Satisfaction (CSAT) scores.
- For Competitive Intelligence: Analyze share of voice and benchmark performance against industry competitors.
Implementation: Building Your Reporting Infrastructure
Organizations generally face a choice between two implementation paths: integrated social suites or bespoke data-visualization platforms.
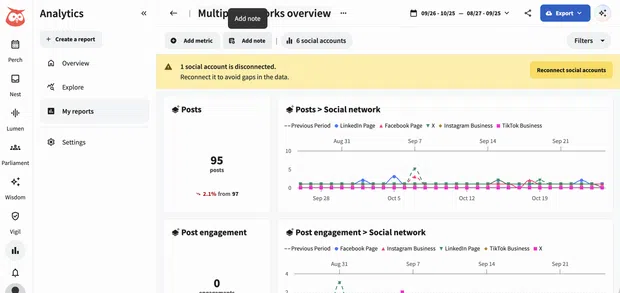
Integrated systems, such as Hootsuite Social OS, offer a turnkey solution where publishing, social listening, and analytics are connected. This enables a seamless flow of data where the actions taken (e.g., publishing a post) are immediately reflected in the performance reports. This ecosystem approach is preferred by enterprise teams that require audit trails and unified access control.
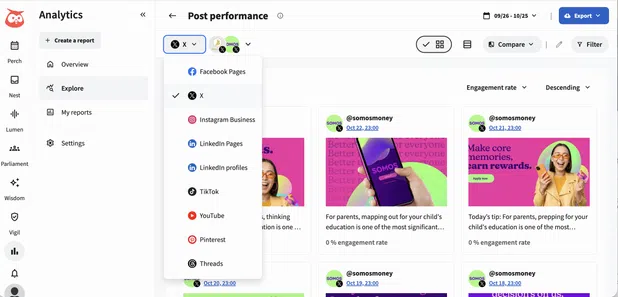
Alternatively, teams with highly specific data requirements often opt for platforms like Google Looker Studio, Klipfolio, or Databox. These tools allow for granular control over visualizations and the integration of diverse data sources beyond social media, such as Salesforce or proprietary internal databases. However, this flexibility comes with a trade-off: the burden of manual setup, ongoing maintenance, and the requirement for technical expertise to configure data connections.
Industry Implications and Future Outlook
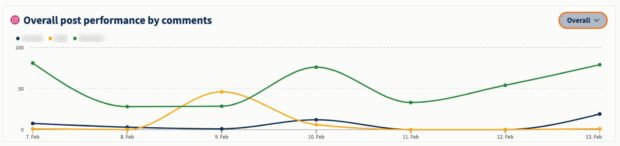
As we look toward 2030, with global social media ad spending expected to approach $530 billion, the sophistication of these tools will only increase. We are entering an era of "intelligent reporting," where dashboards will not only display what happened but will use predictive modeling to suggest what should happen next.

For the modern marketer, the dashboard is no longer just a window into the past; it is a vital tool for competitive survival. Whether it is an employee advocacy program aimed at organic amplification or a paid media campaign requiring real-time budget optimization, the ability to present data in a concise, stakeholder-ready format is what separates successful marketing teams from those struggling to justify their budgets.
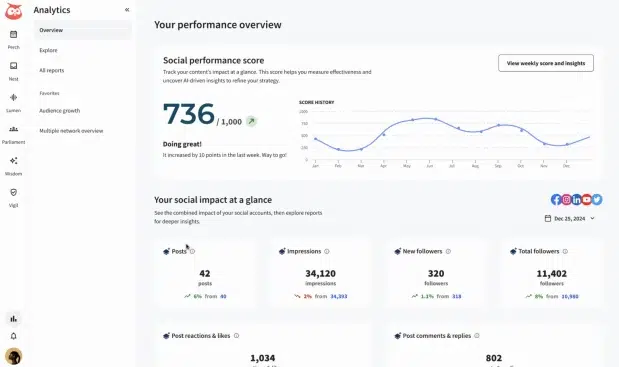
To ensure success, teams must adhere to a core set of principles: maintain a clean data environment, keep stakeholder views focused, ensure cross-platform consistency, and above all, ensure that every metric displayed has a direct line to a business objective. By formalizing this reporting infrastructure, organizations can secure their place in an increasingly crowded and competitive digital marketplace, ensuring that their social media efforts are not just visible, but demonstrably valuable to the enterprise.