Mastering X Analytics: A Comprehensive Guide to Navigating Performance Data and Strategy in 2026

The landscape of social media performance tracking underwent a significant transformation in early 2026, shifting from a once-open ecosystem to a bifurcated model that prioritizes paid subscriptions. For marketing professionals, business owners, and content creators, understanding how to extract actionable intelligence from X—formerly known as Twitter—is no longer just about observing vanity metrics. It has become a complex exercise in data management, requiring a blend of native platform tools, third-party analytical software, and a strategic approach to aligning engagement data with business goals.

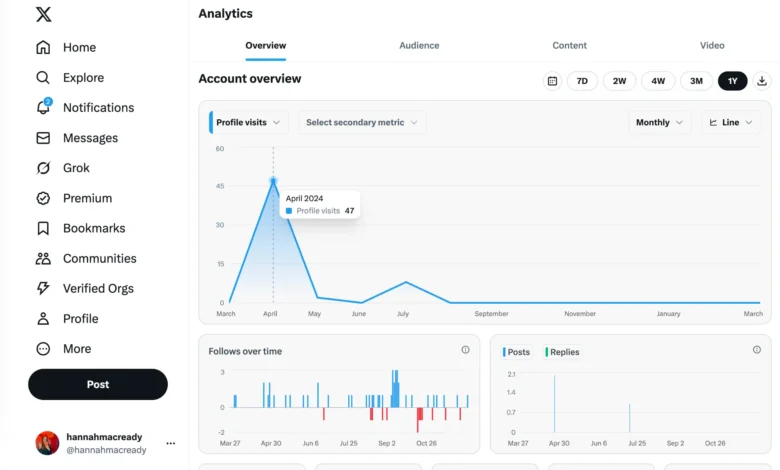
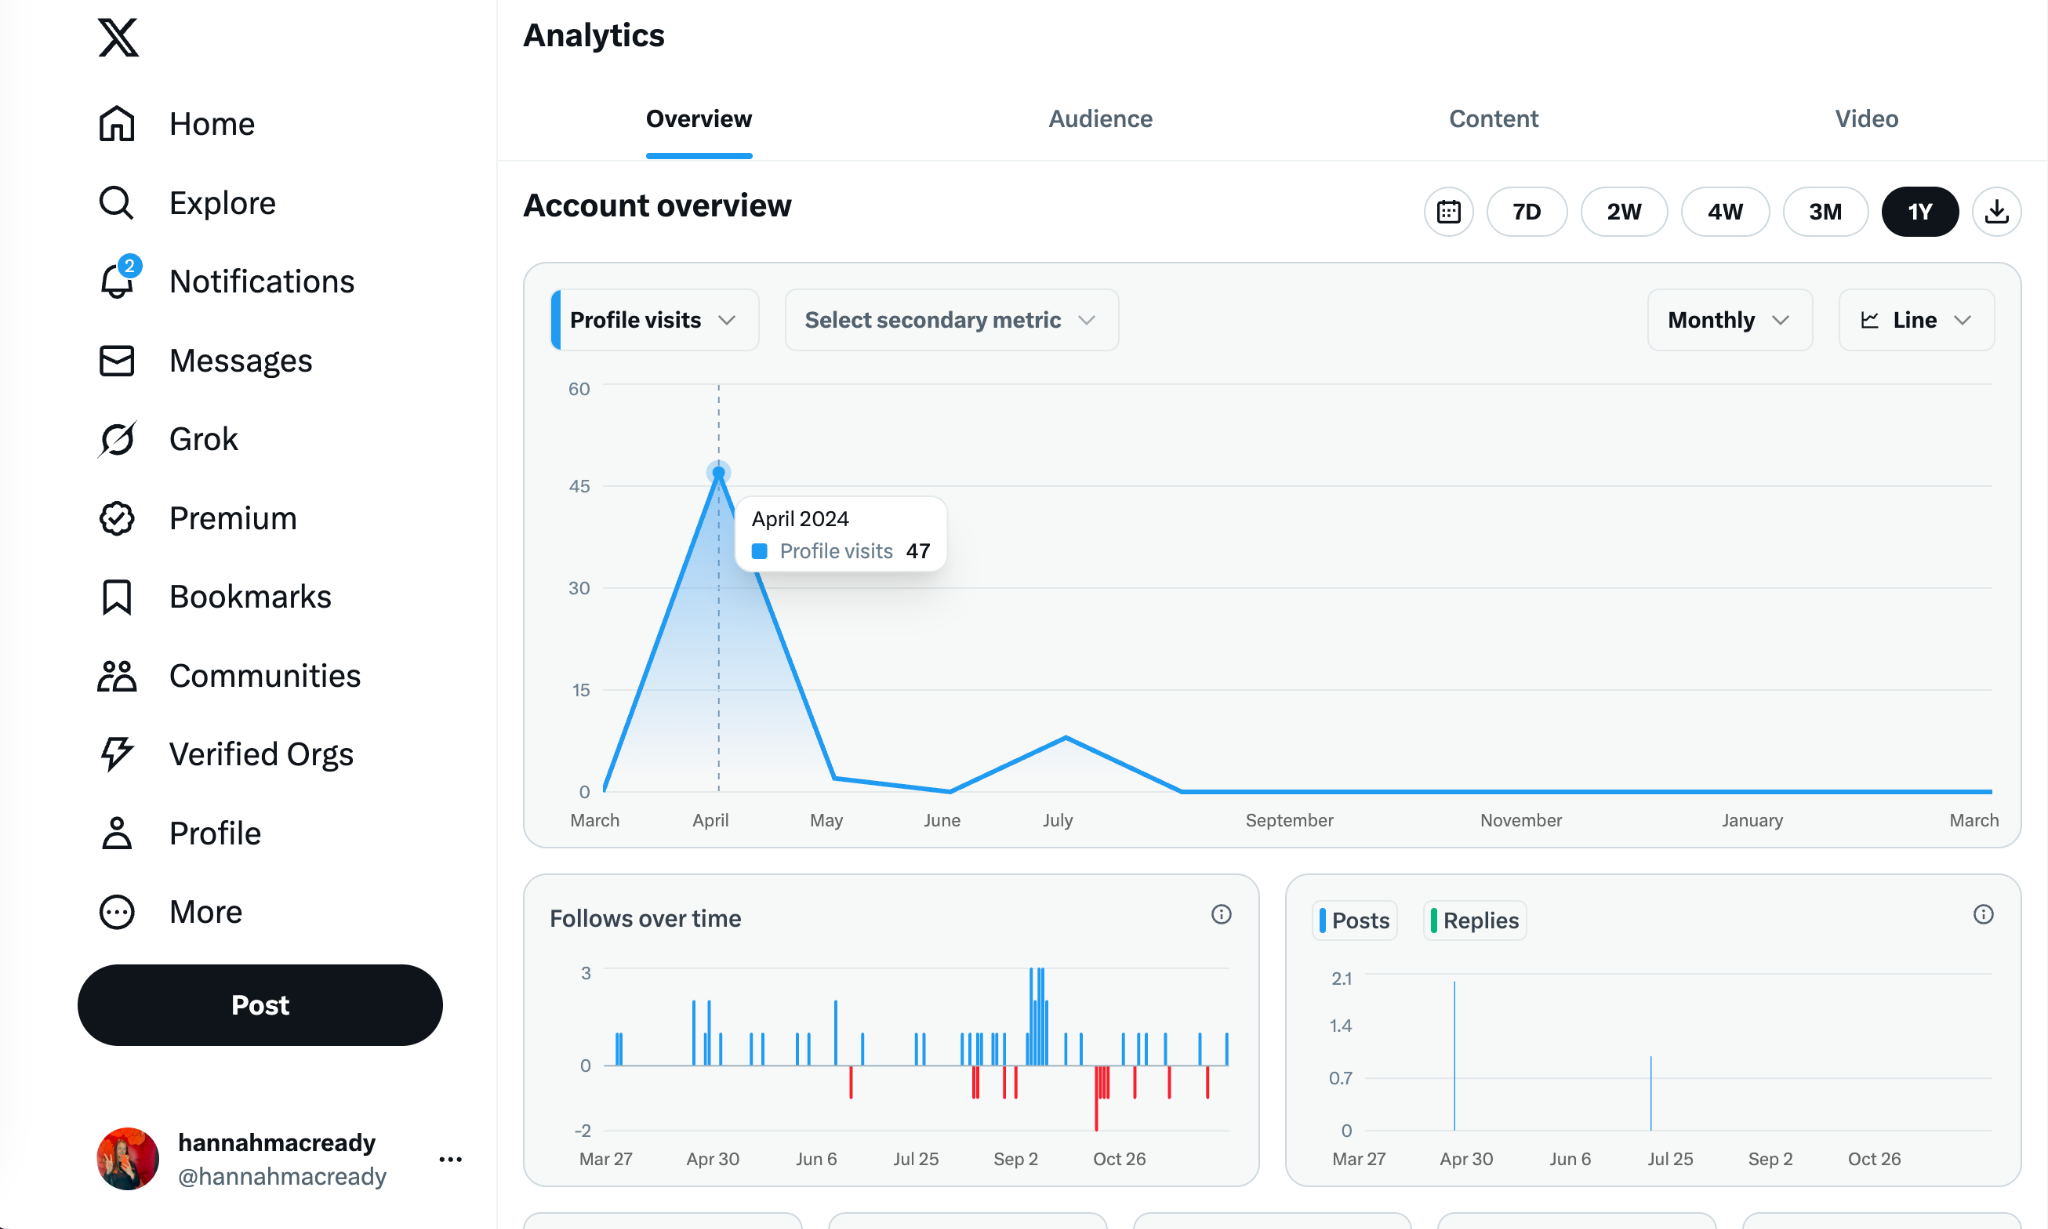
The transition of the full X analytics dashboard behind the Premium paywall marked a departure from the platform’s long-standing policy of providing free, comprehensive reporting. As of early 2026, approximately 4.4 million paid subscribers have access to the complete suite of performance metrics. This shift has forced non-subscribers to rely on post-level data or specialized external tools to gauge their digital footprint.
The Evolution of X Analytics Access
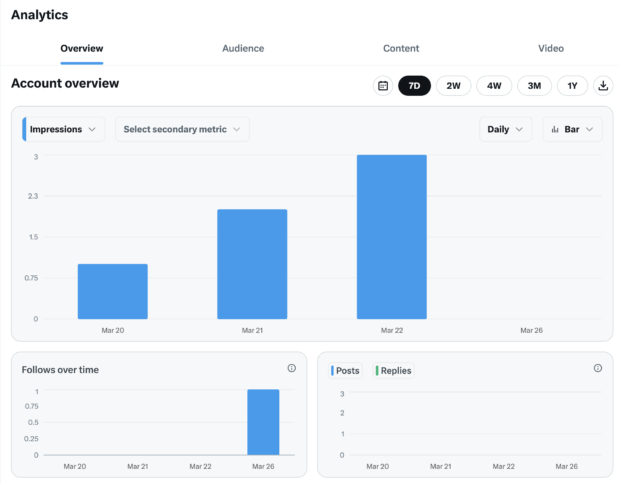
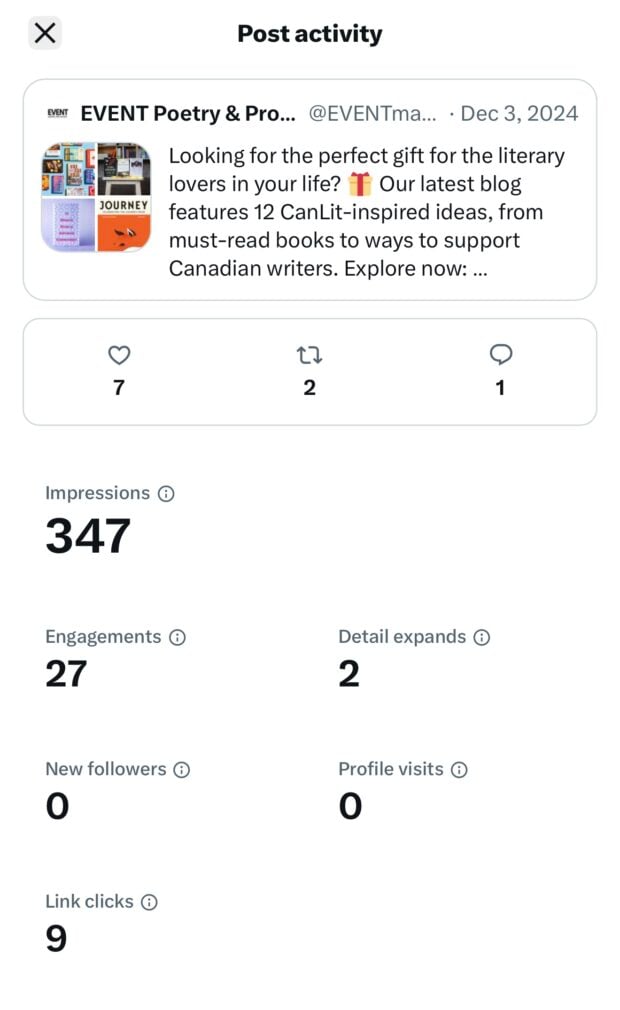
Historically, Twitter provided all users with a granular view of their account performance, allowing for year-over-year growth comparisons and deep dives into audience demographics without additional costs. The current architecture, however, limits free accounts to viewing metrics on an individual post basis through the mobile application. This "post-level" view offers a snapshot of impressions, engagement rates, and profile interactions, but it lacks the longitudinal perspective required for robust quarterly reporting or long-term trend analysis.
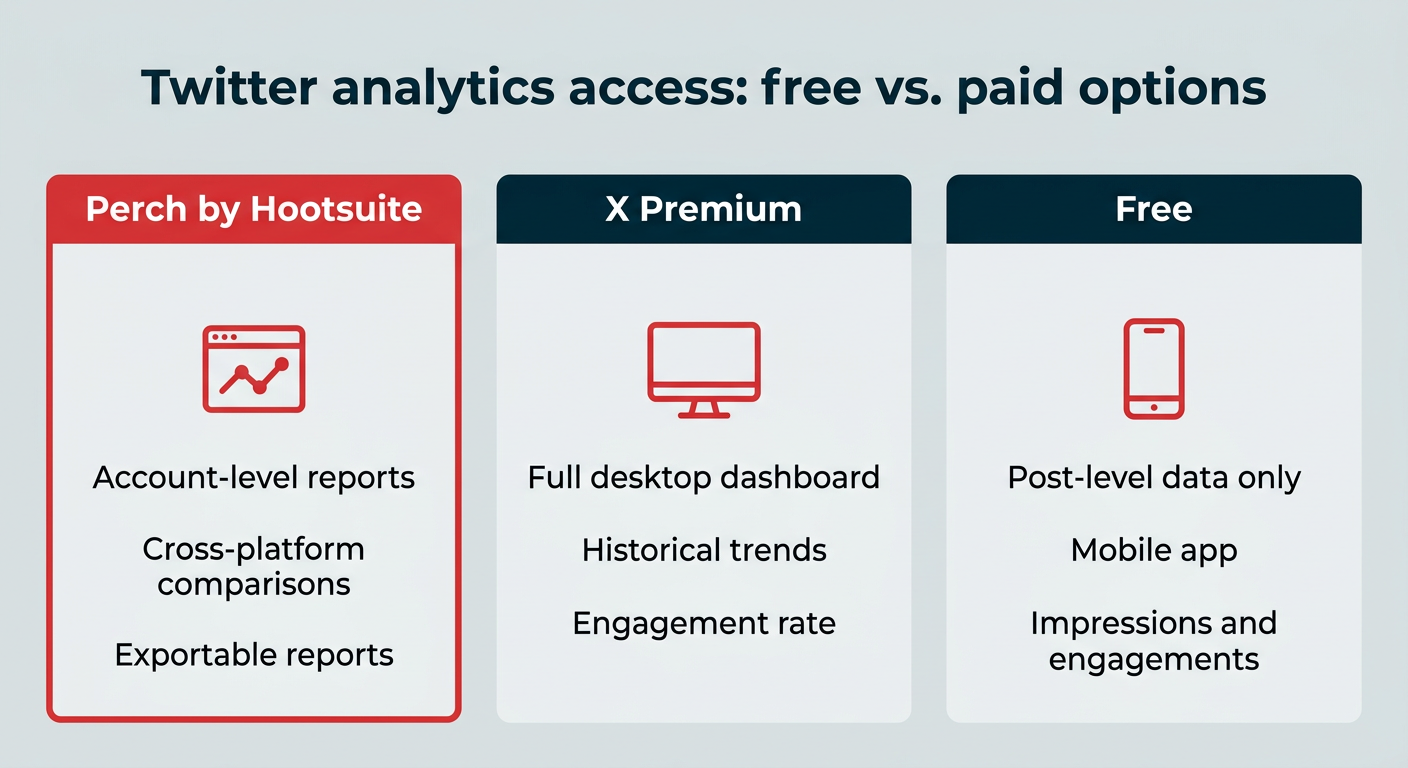
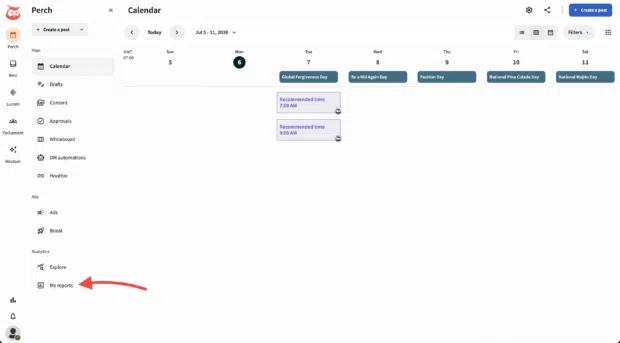
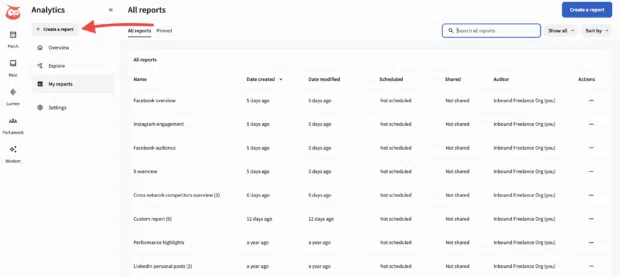
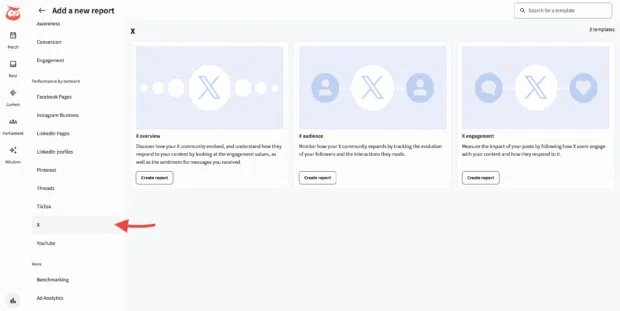
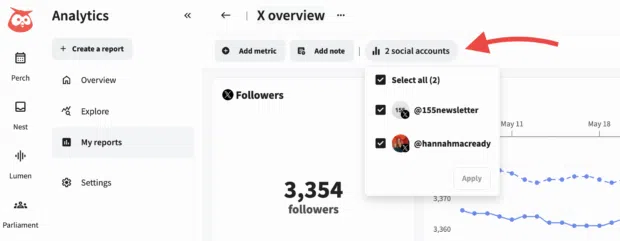
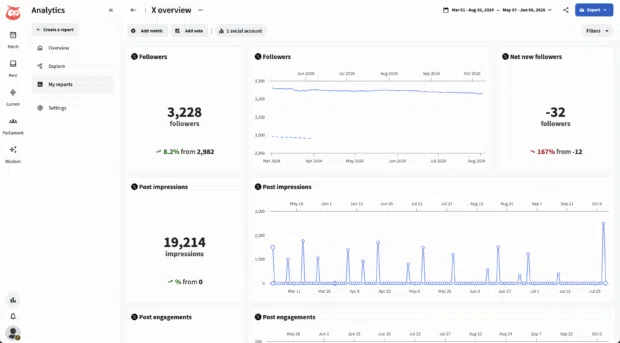
For professional social media managers, this limitation has necessitated a migration toward enterprise-grade management platforms. Tools such as Perch by Hootsuite have become essential infrastructure, allowing organizations to bypass the limitations of the native free interface while centralizing data across multiple social networks. By integrating X performance data into broader marketing dashboards, companies can now correlate social sentiment with website traffic and conversion rates, moving beyond the simple "like" count.
Defining Key Metrics in a Data-Driven Strategy
In the current digital environment, a high-performing strategy is defined by the ability to map specific metrics to overarching business objectives. Modern analytics platforms track over a dozen distinct data points, but industry experts emphasize focusing on those that indicate genuine audience movement.
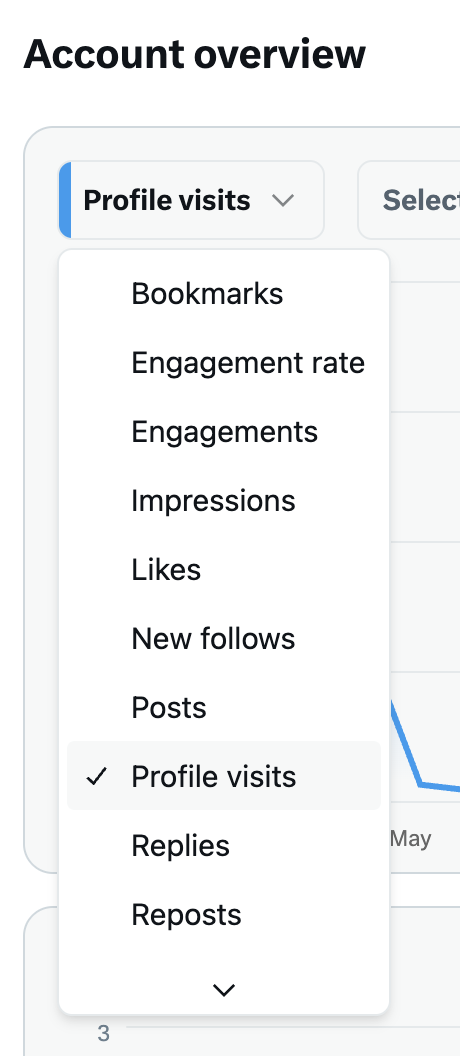
- Engagement Rate: Calculated by dividing total interactions—such as replies, reposts, likes, and link clicks—by total impressions. This remains the gold standard for measuring how well content resonates with a target audience. A low engagement rate often signals that the "hook" of a post or the relevance of the topic has missed the mark.
- Impression vs. Reach: While impressions quantify the total number of times a post has appeared on a screen, reach provides the unique account count. Understanding this delta is critical for brands measuring brand awareness. In 2025, average impressions across the platform saw a 5% year-over-year decline, making the pursuit of high-quality, shareable content more vital than ever.
- Follower Growth Velocity: Monitoring the net change in followers over time provides an immediate feedback loop regarding brand perception. A sudden decline or stagnation is frequently the first indicator of a shift in content tone or a mismatch between brand messaging and audience interests.
Strategic Implementation and Benchmarking
Effective data analysis requires the establishment of a baseline. Without knowing the average performance metrics of previous quarters, it is impossible to identify anomalies—whether positive or negative. According to data aggregated throughout 2025, the average post on X generates approximately 33 likes and 7 reposts. Brands that find themselves consistently above these figures can reasonably claim to have a competitive advantage in audience retention.

Nick Martin, a social media marketing professional, suggests that the most successful strategies involve a "zoom-in, zoom-out" approach. By evaluating the daily performance of individual posts, managers can adjust their immediate tactics, such as changing post length or adding visual elements. Simultaneously, zooming out to view monthly and quarterly trends allows for the adjustment of high-level brand strategy.

The Role of Competitive Intelligence
One of the most underutilized aspects of social media analysis is the use of public data to monitor competitors. While private internal analytics are inaccessible, public-facing signals—such as the frequency of replies, the nature of community engagement, and the specific topics that trigger high repost volumes—serve as a roadmap for what works within a specific niche.
Social listening tools now allow brands to create private streams that monitor competitors in real time. This practice is no longer just about tracking "vanity" metrics; it is about gathering intelligence on shifts in market sentiment. For example, if a peer brand experiences a surge in engagement following a specific type of thread or video, that information can inform a company’s own content calendar, potentially reducing the costs of trial-and-error experimentation.
Implications for Enterprise Reporting
For larger organizations, the requirements for reporting extend far beyond the marketing department. Insights derived from X analytics are increasingly being utilized by product development and sales teams.
- Product Development: By analyzing the sentiment and specific keywords associated with brand mentions, product teams can identify recurring customer pain points or feature requests.
- Sales Enablement: Tracking link clicks and referral traffic from social channels provides sales departments with actionable leads—individuals who have moved from "passive scrollers" to "engaged prospects."
- Creative Direction: Identifying high-performing content formats allows creative teams to optimize design choices, ensuring that assets are tailored to the visual preferences of the target demographic.
Navigating the Payout and Ad Revenue Model
A point of confusion for many users remains the relationship between performance and monetization. The creator ad revenue sharing program, which pays out based on ads served in the replies to posts, is often misunderstood as a performance metric. In reality, this revenue is a variable byproduct of traffic and engagement, not a reliable indicator of brand health.
For the purposes of professional reporting, marketers are advised to treat revenue-sharing income as an auxiliary benefit rather than a core KPI. The focus for any enterprise-level reporting should remain firmly on metrics that demonstrate a clear return on investment: conversions, website traffic, and qualified lead generation.
Future Outlook and Tooling
As we progress through 2026, the reliance on advanced analytics tools will likely increase. As platforms continue to gatekeep data, the gap between those who can afford sophisticated analysis tools and those who cannot will continue to widen. The current market offers a range of solutions, from cost-effective options like Buffer, which provides streamlined post-level reporting, to robust enterprise suites like Perch by Hootsuite, which offer deep-dive capabilities and cross-platform synthesis.
Ultimately, the most successful brands will be those that view their X analytics not as a chore, but as a critical business intelligence tool. By moving away from surface-level metrics and toward data that reflects the actual customer journey, organizations can ensure that their presence on the platform translates into tangible, long-term business growth. The ability to interpret these metrics, translate them into strategy, and present them as clear ROI to stakeholders will define the next generation of social media leadership.