
Mastering Social Video Metrics: A Comprehensive Guide to Measuring Content Performance and ROI


In the current digital landscape, where approximately $1 out of every $5 spent on digital advertising is allocated to social video, the ability to interpret and act upon performance data has become a fundamental business requirement. As platforms like TikTok, Instagram, and LinkedIn continue to prioritize short-form video, marketing teams are under increasing pressure to move beyond vanity metrics—such as raw view counts—and demonstrate how video content contributes to tangible business objectives, including lead generation, pipeline growth, and overall return on investment.

The shift toward video-centric algorithms has made the granular analysis of viewer behavior a necessity rather than a luxury. By examining key performance indicators (KPIs) such as retention graphs, completion rates, and conversion paths, organizations can transition from a "post-and-pray" strategy to a data-informed methodology that aligns creative output with corporate goals.
The Evolution of Video Metrics Across Platforms
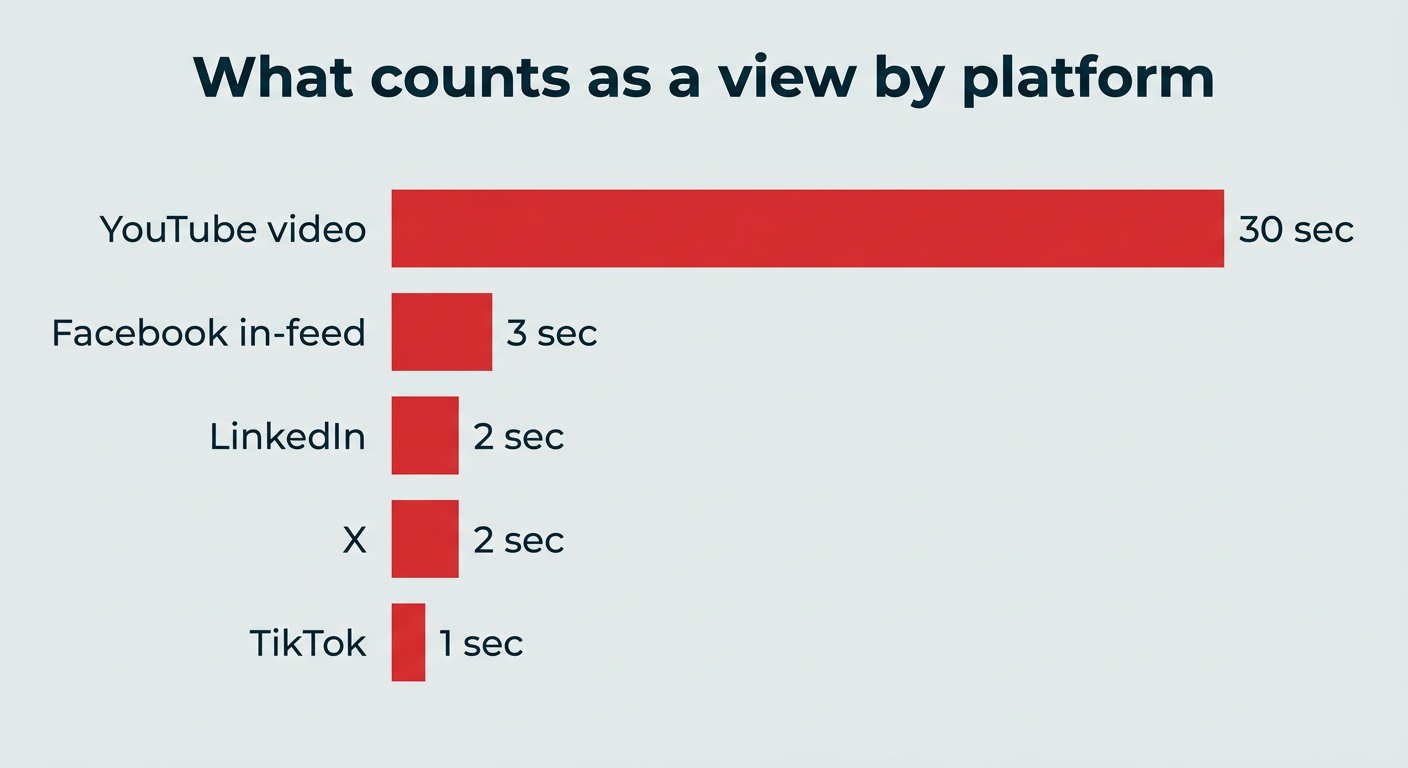
The challenge for modern marketers is that "success" is defined differently by each social media ecosystem. A "view" on TikTok, for instance, is recorded after just one second of playback, whereas YouTube requires a viewer to watch for 30 seconds before a view is officially tallied. LinkedIn and X (formerly Twitter) operate under different standards, often requiring a threshold of at least two seconds of playback with 50% of the video visible on the screen.

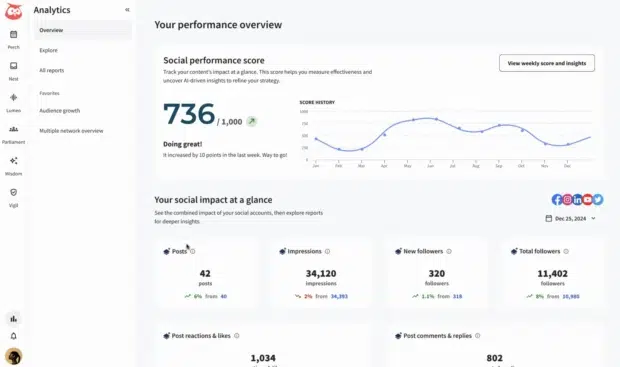
This lack of standardization across platforms has created a significant hurdle for cross-channel reporting. Historically, teams have relied on manual, time-consuming processes—often involving the stitching together of screenshots from six or more disparate dashboards. However, as the sophistication of social analytics tools increases, brands are moving toward centralized "Social OS" platforms that allow for unified reporting. This consolidation is vital for stakeholders, as it transforms fragmented data into a cohesive narrative that can justify marketing budgets and personnel allocation.
Mapping Metrics to Strategic Business Objectives
To extract value from video analytics, organizations must categorize their metrics based on their specific campaign objectives. A campaign designed to boost brand awareness requires a different set of KPIs than one focused on community building or direct conversion.
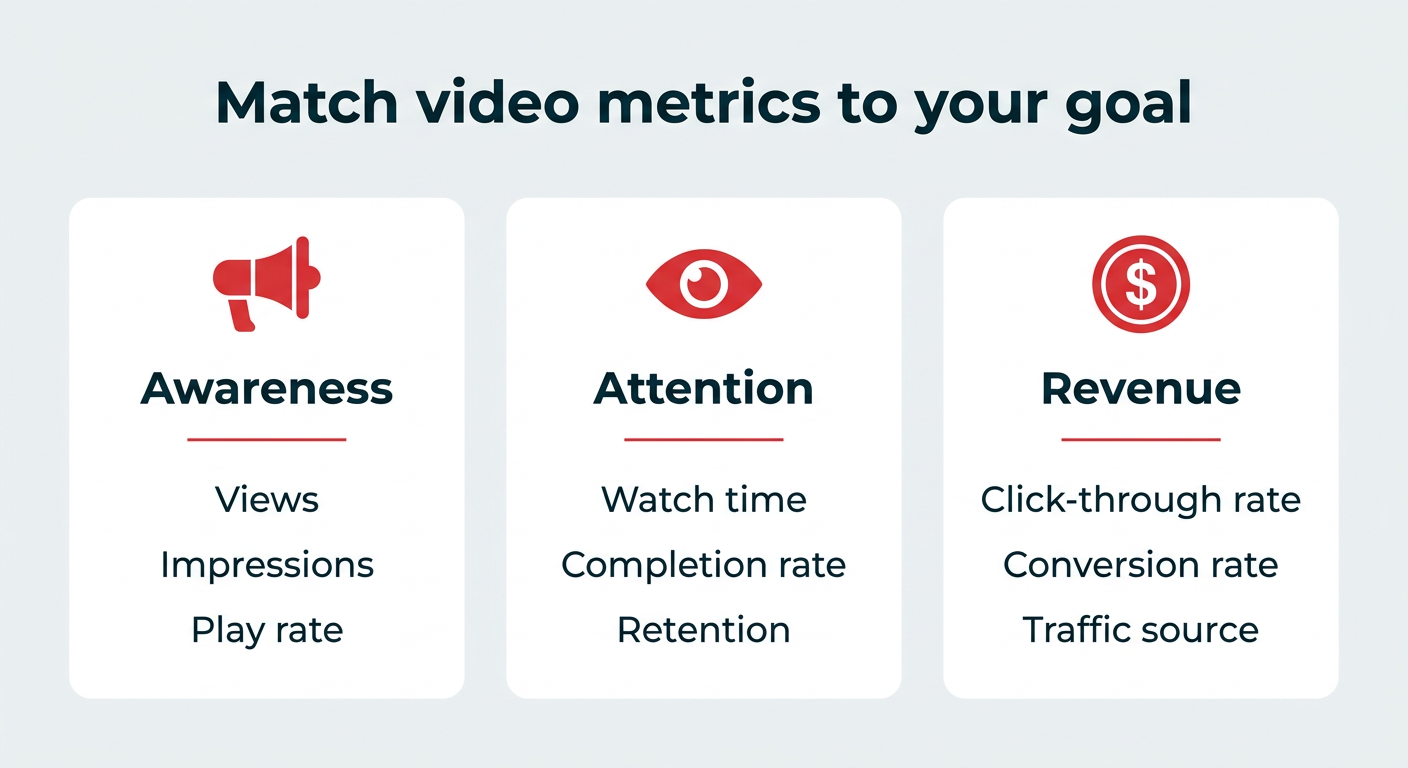
For brand awareness, the primary indicators are reach, impressions, and views. Conversely, when the goal is audience retention or engagement, the focus shifts to average watch time, completion rates, and the number of shares or saves. The latter—saves—have emerged as a particularly high-value signal for algorithms; they represent a "bookmarking" behavior that indicates high content utility. When a user saves a video, they are effectively signaling to the platform that the content is worth revisiting, which in turn boosts the video’s reach through organic algorithmic recommendation.
The Diagnostic Power of Retention Data
Perhaps the most critical, yet underutilized, metric is the retention graph. Unlike a simple average watch time, which provides a high-level overview, a retention graph allows producers to pinpoint exactly where a viewer loses interest.
Data analysis consistently shows that the first three seconds of a video are the most vital. In an era of infinite scrolling, these initial moments serve as the "hook." If a video experiences a sharp drop-off in viewers at the four-second mark, the issue is almost certainly with the opening sequence. Conversely, if the drop-off occurs at the midpoint, the issue may be pacing or a lack of sustained narrative value. By analyzing these "dead zones," content teams can refine their editing styles, shortening transitions and ensuring that each second provides enough visual or intellectual stimuli to keep the viewer engaged.
The ROI Calculation and Financial Accountability
For many organizations, the ultimate goal of video marketing is the realization of a positive ROI. Calculating this requires a systematic approach that bridges the gap between social engagement and financial performance. The calculation process involves four distinct steps:

- Aggregating all costs associated with the video, including creative production, talent, software, and paid media spend.
- Tracking conversions using attribution models, such as UTM parameters or platform-specific pixels (e.g., the Meta Pixel or LinkedIn Conversions API).
- Measuring the total revenue generated from those tracked conversions.
- Applying the ROI formula: (Net Profit from Video / Cost of Video) x 100.
While this quantitative approach is essential for bottom-funnel assets, it is important to acknowledge that top-of-funnel brand awareness content may not always have a direct, linear path to revenue. In such cases, experts suggest using cost-per-thousand impressions (CPM) or cost-per-view (CPV) as secondary benchmarks to maintain credibility in reporting.
Strategic Recommendations for Content Optimization
Industry leaders and marketing strategists consistently emphasize a few core principles for improving performance. First, the "mute test" remains a gold standard for quality control: if a video’s visuals cannot convey the message without sound, the creative is likely insufficient for the current viewing habits of mobile users.
Second, the trend toward "loopable" content—videos designed to be watched multiple times to fully grasp the information—has proven highly effective in driving engagement. By incorporating subtle visual cues or "Easter eggs," creators encourage repeat viewings, which the algorithms of platforms like Instagram and TikTok treat as a strong signal of quality.
Third, the integration of AI-assisted tools in the production process is rapidly changing how content is scaled. AI is now being utilized to break down complex internal documents into short, "talking-head" video explainers. This format has seen particular success in the B2B sector, where audiences prioritize clarity and authenticity over high-production aesthetic polish.

Broader Implications for the Industry
The move toward data-driven video strategy reflects a wider shift in the digital economy. As social platforms continue to compete for "time spent," they are incentivizing content that keeps users on the platform for longer durations. This has forced brands to adopt a more rigorous, scientific approach to content creation.
The implications for the industry are clear: companies that invest in the ability to analyze their video performance will gain a competitive advantage. Those that ignore these metrics risk wasting resources on content that fails to resonate or, worse, fails to reach its intended audience entirely. As the tools for measurement become more accessible and integrated, the barrier to entry for high-quality, data-backed video marketing will continue to lower, making it incumbent upon all marketing departments to adopt a culture of continuous testing, measuring, and refining.

In summary, the transition from intuitive content creation to performance-based video strategy is not merely a trend; it is the new standard of professional digital marketing. By focusing on metrics that matter, understanding the nuances of platform-specific behavior, and rigorously tracking the relationship between engagement and revenue, brands can ensure their video strategies remain sustainable and effective in an increasingly crowded digital marketplace.