
Social Media Benchmarks: Unlocking Performance Across Key Industries in a Data-Driven Era

Understanding whether 100 likes on a social media post constitutes a success or a missed opportunity is a challenge frequently faced by digital marketers. In an increasingly competitive and algorithm-driven online landscape, isolated performance metrics offer limited insight. The solution lies in the strategic application of social media benchmarks—industry standards that provide crucial context, enabling brands to accurately gauge their performance against similar entities and refine their digital strategies.
The dynamic nature of social media platforms necessitates a data-driven approach to marketing. What constituted "good" engagement or growth a few years ago might be significantly different today, and what works for one industry may fall flat in another. Social media benchmarks provide a vital compass, offering typical performance indicators for metrics such as engagement rate, reach, and follower growth. By comparing their Key Performance Indicators (KPIs) against these benchmarks, organizations can move beyond mere internal trend analysis to understand their standing within the broader industry, identifying areas for improvement and opportunities for competitive advantage. This contextual understanding is indispensable for setting realistic yet ambitious social media goals, preventing burnout within marketing teams by establishing achievable targets, and effectively communicating the value of social media efforts to stakeholders.
The evolution of social media measurement has mirrored the platforms themselves. Early days often focused on vanity metrics like raw follower counts, but as the digital ecosystem matured, the emphasis shifted towards more meaningful engagement and conversion metrics. The ability to track and analyze vast amounts of data, coupled with advancements in analytics tools, has propelled benchmarks from a niche concept to a fundamental component of any robust social media strategy. Modern social media management platforms, such as Hootsuite Analytics, now integrate sophisticated benchmarking tools that allow users to compare their performance against industry averages with remarkable ease. This shift signifies a maturation of digital marketing, where strategic decisions are increasingly underpinned by empirical data rather than intuition alone.
Unveiling Industry-Specific Trends Through Data Analysis
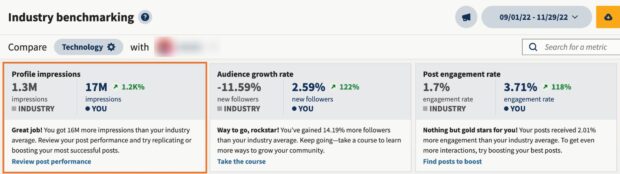
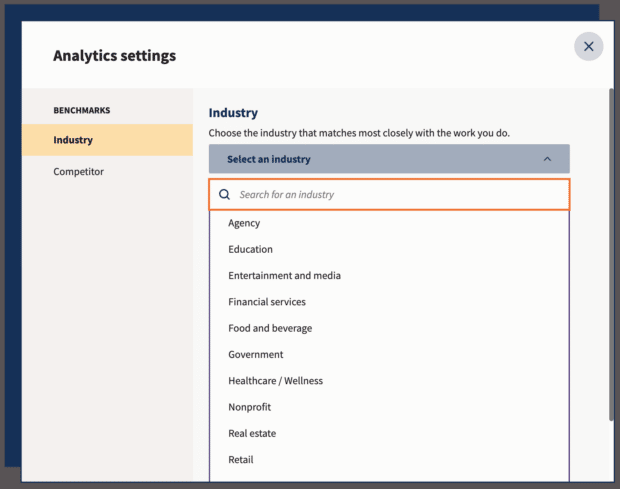
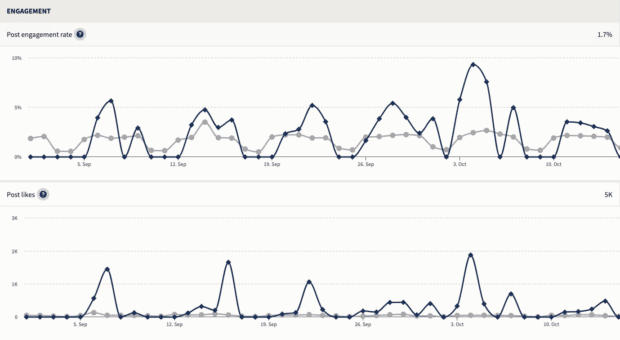
Hootsuite’s comprehensive analysis, drawing data from its extensive user base across various sectors, reveals distinct patterns in social media performance. To leverage this, businesses simply navigate to the "Analytics" section in their Hootsuite dashboard, select "Benchmarking," and choose their relevant industry category. This provides an immediate, actionable comparison across critical metrics like post engagement rate, average follower growth, best-performing content types, and optimal posting frequencies on platforms including Instagram, Facebook, X (formerly Twitter), LinkedIn, and TikTok. Beyond mere comparison, the platform also offers tailored recommendations for performance enhancement, and reports can be easily exported for stakeholder presentations. The following findings highlight some of the most compelling insights across key industries:
Education Sector: Engagement Through Visual Narratives
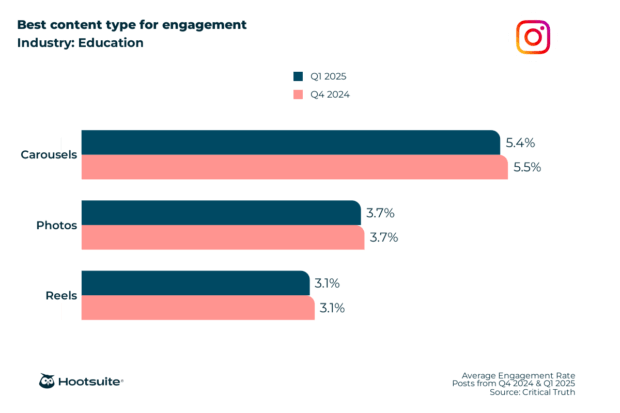
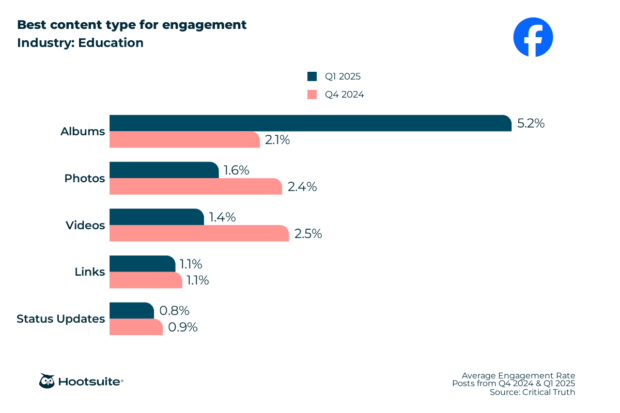
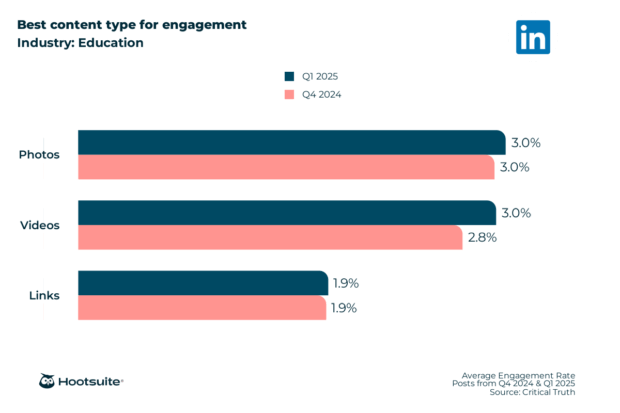
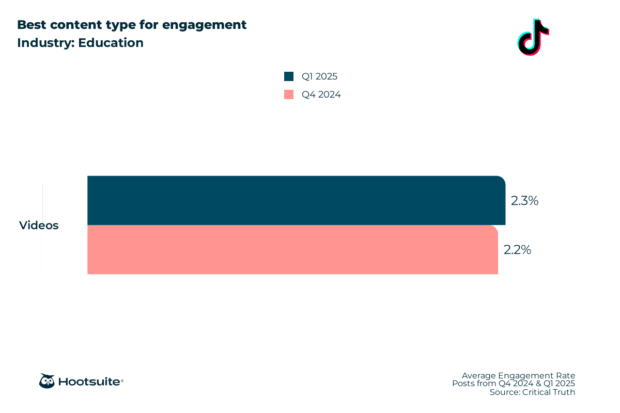
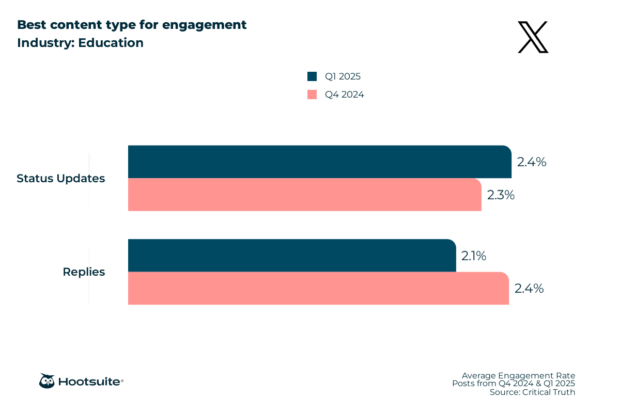
In the education industry, engaging content is paramount. Facebook sees the highest engagement from albums (5.2%), indicating a preference for multi-image storytelling, perhaps showcasing campus life, events, or student achievements. On Instagram, carousels excel with a 5.4% engagement rate, capitalizing on the platform’s visual nature and providing an interactive way to deliver educational snippets or program highlights. LinkedIn, the professional network, shows photos and videos performing equally well at 3.0%, suggesting a blend of visual and informative content resonates with a professional audience. Unsurprisingly, videos dominate TikTok with 2.3% engagement, aligning with the platform’s short-form video ethos. X (Twitter) thrives on status updates (2.4%), reflecting its role as a platform for quick announcements and discussions.
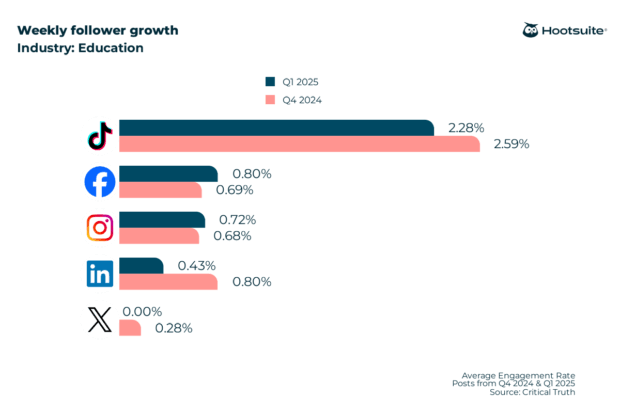
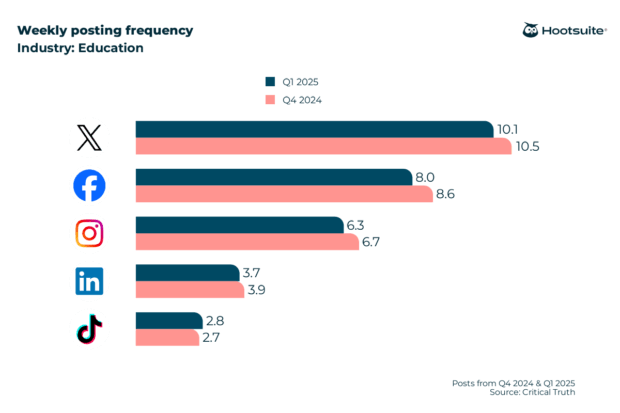
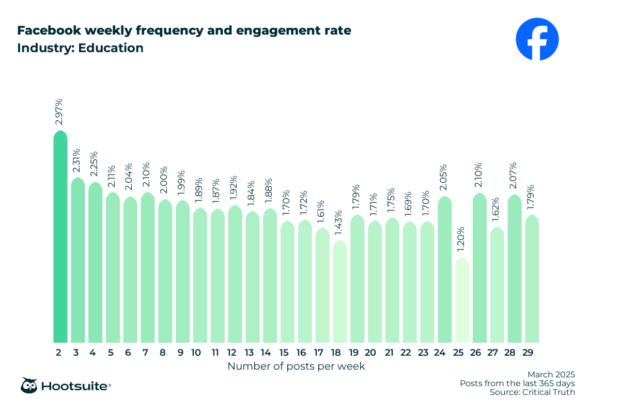
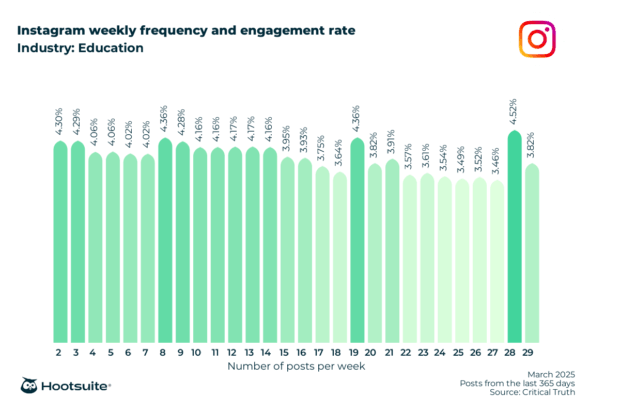
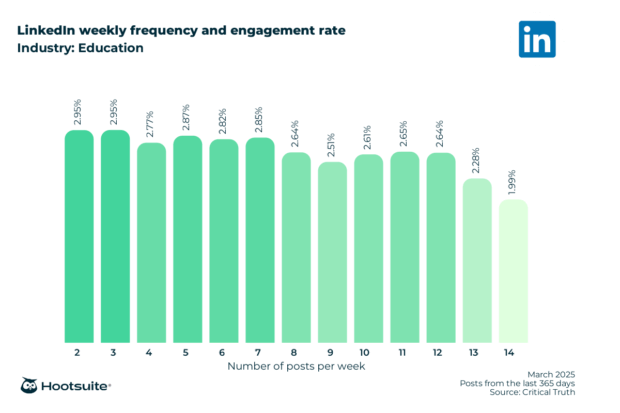
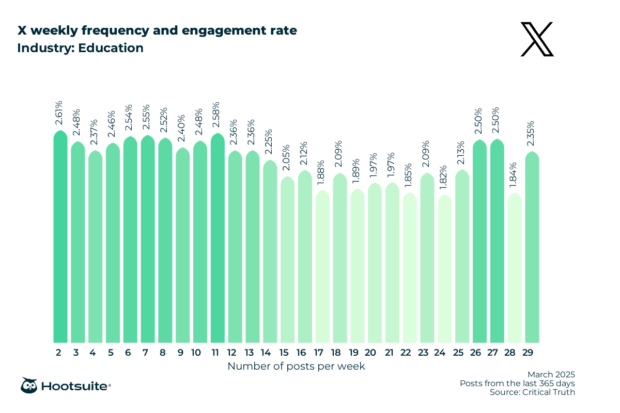
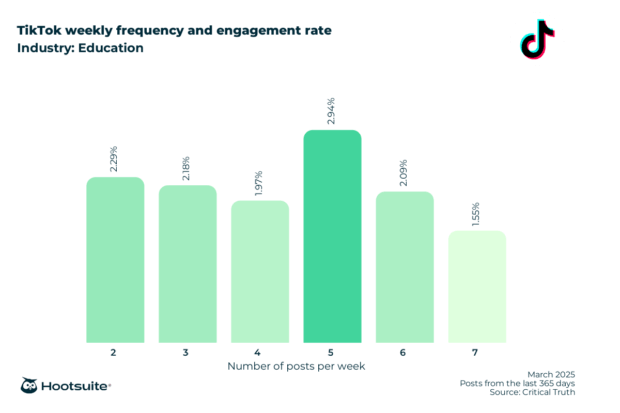
From a growth perspective, TikTok emerges as a significant channel for educational institutions, demonstrating an average weekly follower growth of 2.28%. This underscores the platform’s growing influence among younger demographics, crucial for student recruitment and engagement. Regarding posting frequency, while the industry posts on X (Twitter) an average of 10.1 times per week, the highest engagement rates on Facebook (2.97%) are achieved with just two posts per week. Instagram, however, sees peak engagement at a much higher frequency: 4.52% with 28 posts weekly, indicating that a constant stream of visual content is favored by its audience. LinkedIn performs best with 2-3 posts (2.95%), X (Twitter) with 2 posts (2.61%), and TikTok with 5 posts (2.94%). These variations emphasize the need for platform-specific strategies.
Entertainment & Media: Captivating Audiences with Dynamic Content
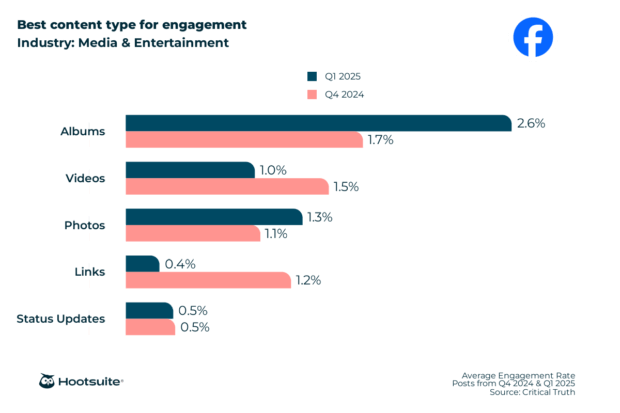
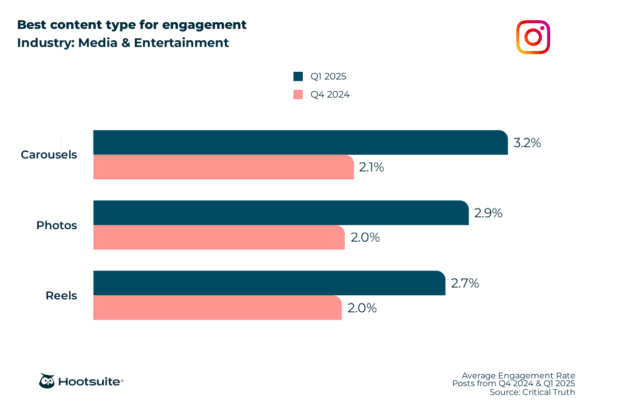
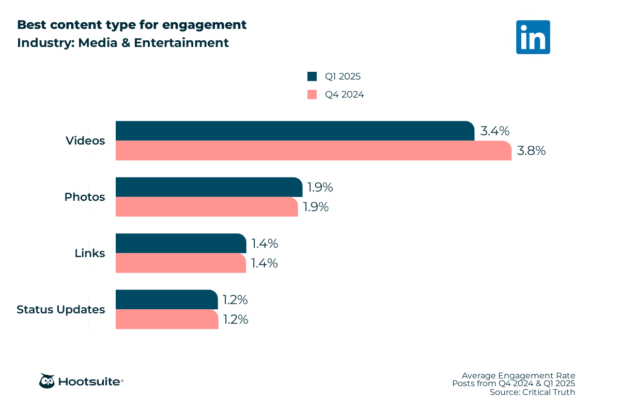
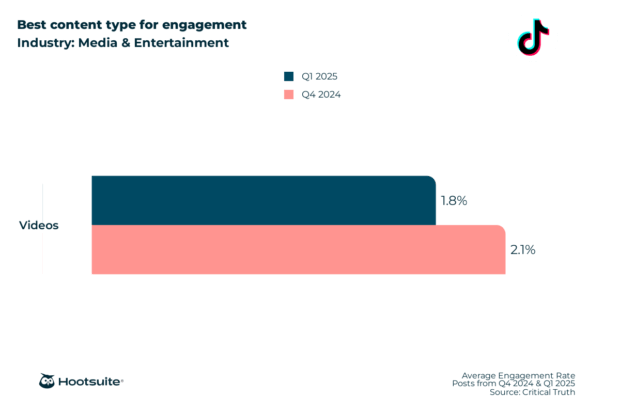
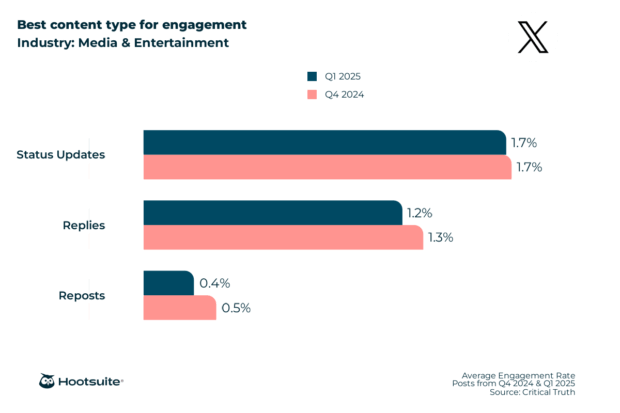
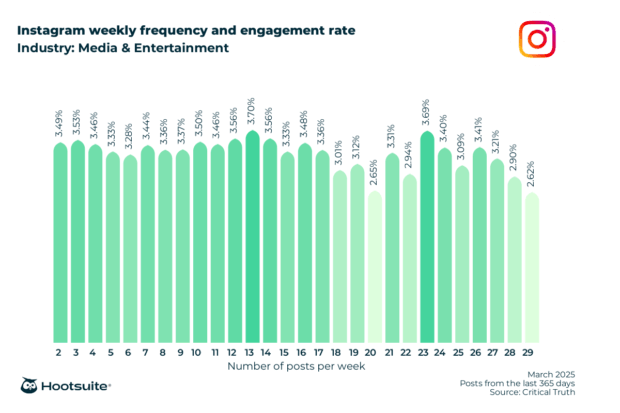
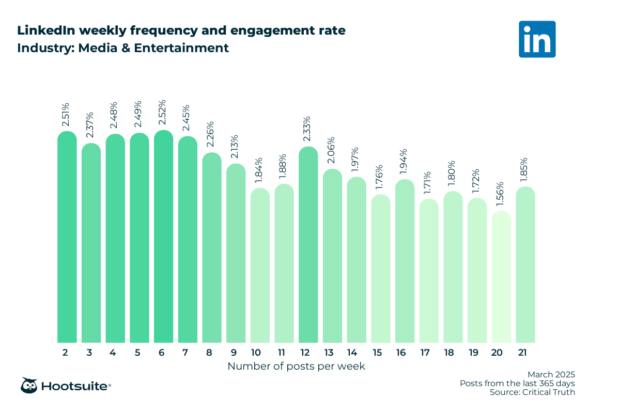
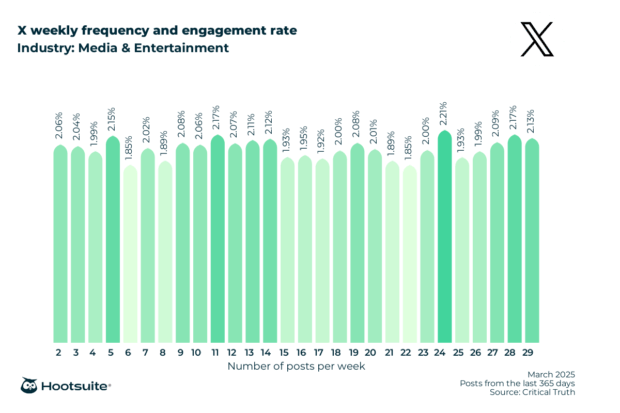
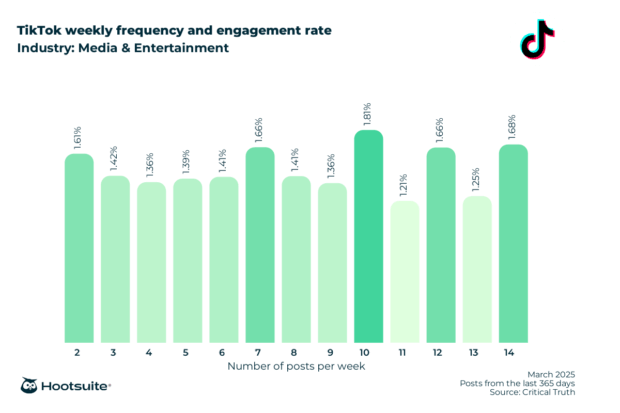
The entertainment and media industry, by its very nature, relies on captivating content. Facebook albums again lead with 2.6% engagement. Instagram’s visual dominance is reaffirmed with carousels achieving 3.2% engagement, followed closely by Reels at 2.7%, highlighting the power of multi-slide and short-form video content for showcasing trailers, behind-the-scenes glimpses, or promotional material. On LinkedIn, videos are the clear winner with 3.4% engagement, reflecting the professional interest in industry news, interviews, and creative projects. TikTok’s strength remains in videos, generating 1.8% engagement, consistent with its entertainment-focused format. X (Twitter) sees status updates leading at 1.7%, ideal for real-time news, celebrity interactions, or event coverage.
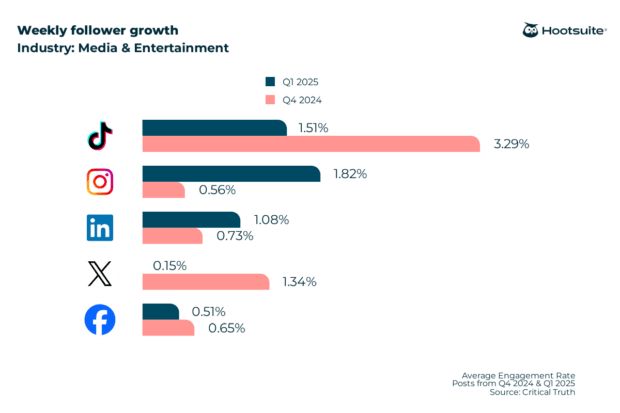
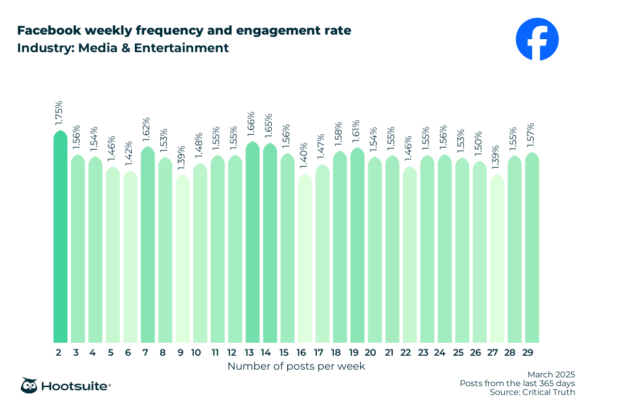
Follower growth rates are particularly strong on Instagram (1.82% weekly), underscoring its role as a primary platform for audience building in this sector. The industry posts most frequently on Facebook (10.8 times weekly), but optimal engagement on Facebook (1.75%) is observed with only two posts per week. Instagram, conversely, benefits from a higher frequency, achieving 3.70% engagement with 13 weekly posts. LinkedIn thrives with 2 posts (2.51%), X (Twitter) with a high 24 posts (2.21%), and TikTok with 10 posts (1.81%). This indicates that while Instagram and X (Twitter) audiences appreciate higher volumes, Facebook and LinkedIn users prefer less frequent, perhaps more curated, content.
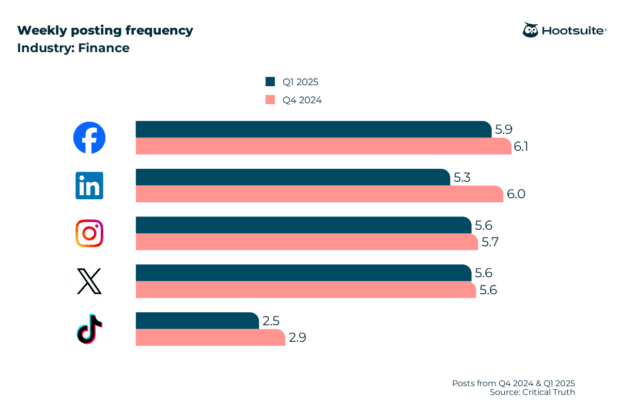
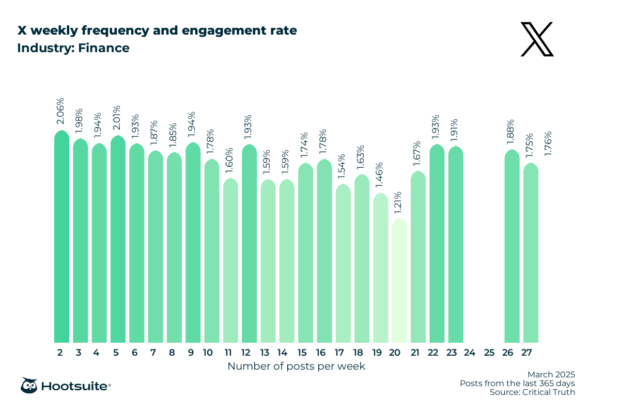
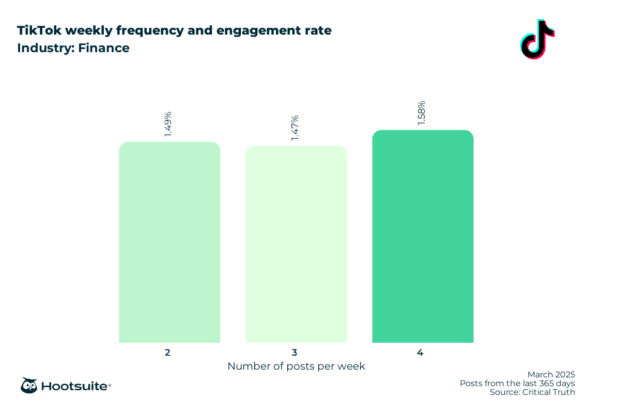
Financial Services: Building Trust and Authority
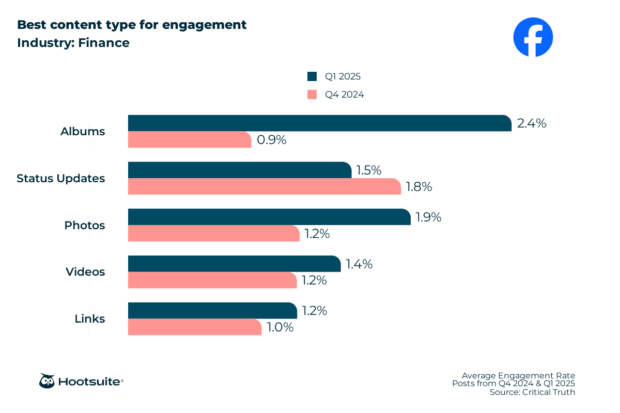
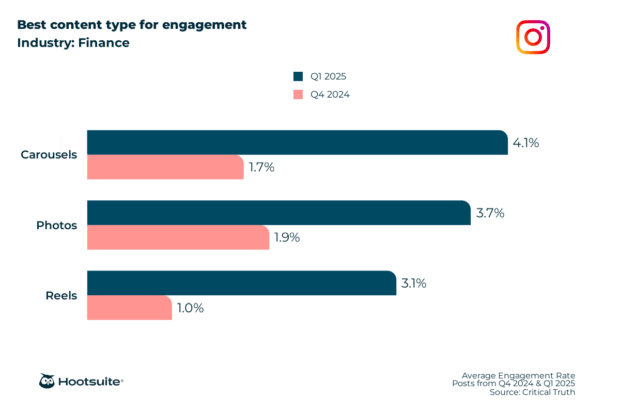
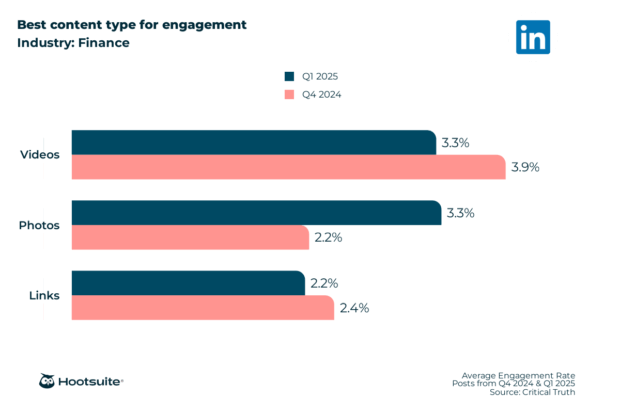
For the financial services industry, building trust and conveying expertise is paramount. Facebook albums lead with 2.4% engagement, potentially for showcasing team members, community involvement, or simplifying complex financial concepts visually. On Instagram, carousels perform best at 4.1%, offering a digestible format for tips, infographics, or multi-step advice. LinkedIn, as expected, sees photos and videos performing equally well at 3.3%, ideal for thought leadership, company culture, and market insights.
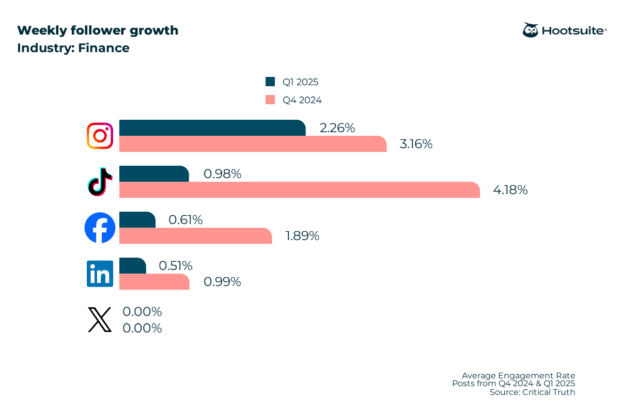
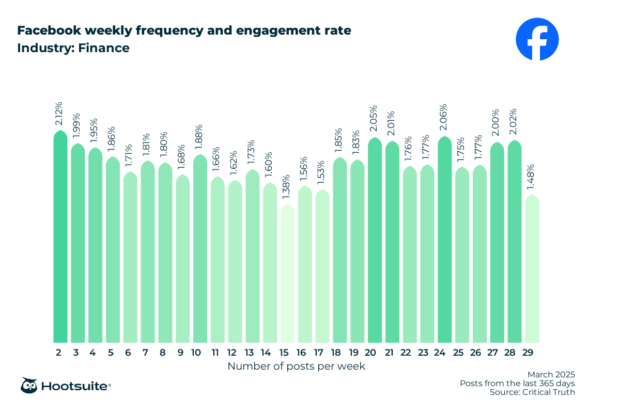
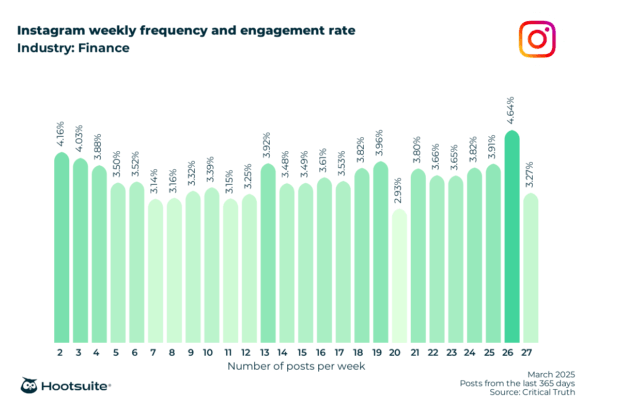
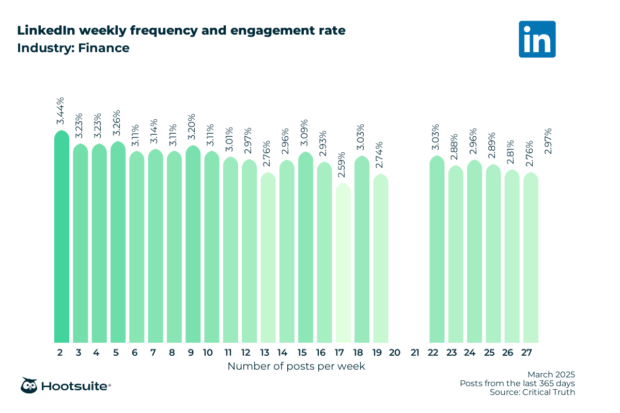
Instagram emerges as the leader in weekly follower growth at 2.26%, suggesting that visually appealing content that demystifies finance or highlights success stories resonates strongly. Financial services post most on Facebook (5.9 times weekly). However, optimal engagement rates are achieved with lower frequencies across most platforms: Facebook (2.12%) and LinkedIn (3.44%) both at 2 posts per week, and X (Twitter) at 2 posts (2.06%). Instagram achieves its highest engagement (4.64%) with a high 26 posts per week, while TikTok performs best with 4 posts (1.58%). This highlights Instagram’s unique role in this sector, demanding consistent visual content.
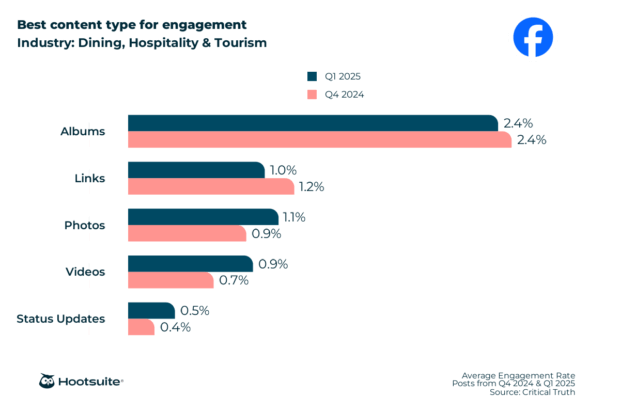
Dining, Hospitality, & Tourism: Inspiring Wanderlust and Experiences
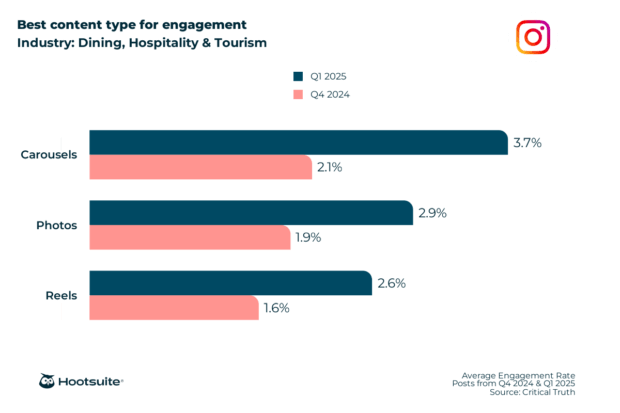
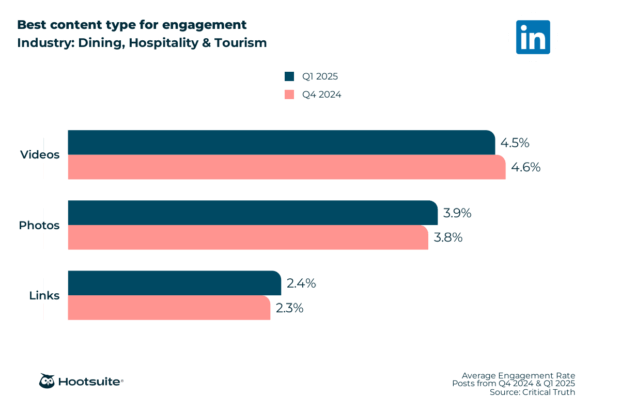
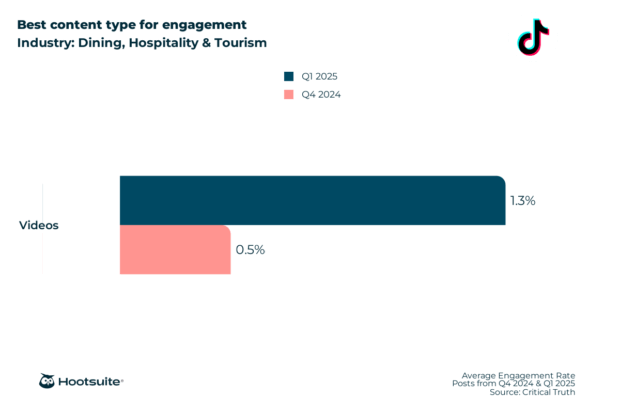
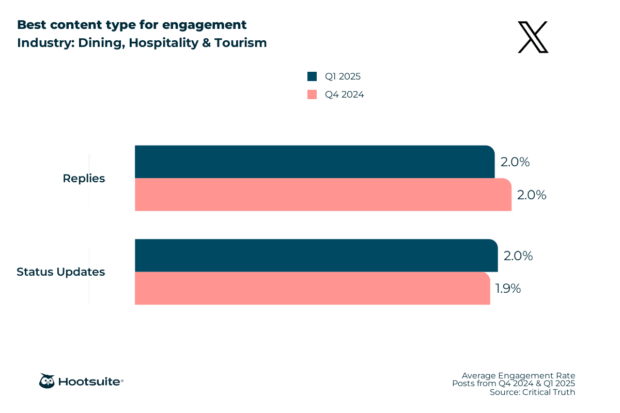
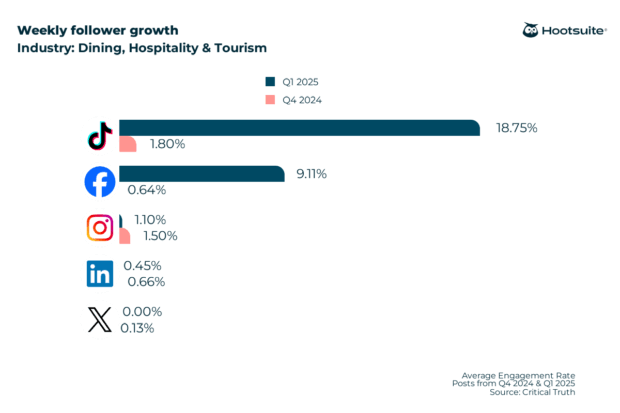
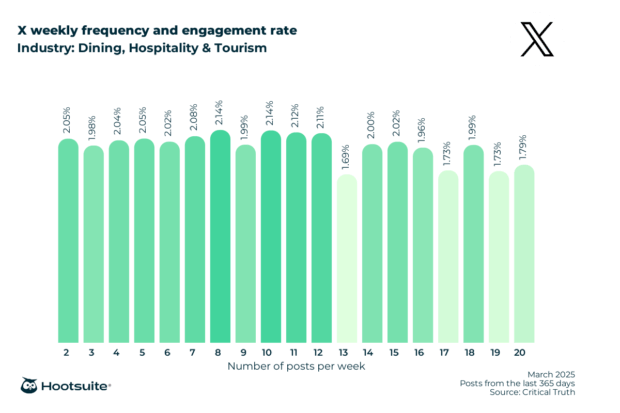
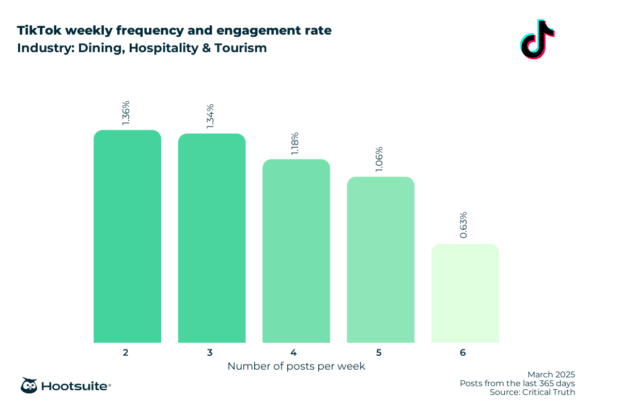
This industry thrives on visual appeal and aspirational content. Facebook albums perform best at 2.4%, perfect for showcasing destinations, dishes, or hotel amenities. Instagram, naturally, sees carousels leading at 3.7%, enabling virtual tours or multi-angle presentations of experiences. LinkedIn prioritizes videos with 4.5% engagement, likely for corporate news, behind-the-scenes content, or employee spotlights. TikTok’s format perfectly suits this industry, with videos achieving 1.3% engagement. On X (Twitter), replies and status updates both hit 2.0%, indicating a mix of direct customer interaction and promotional messaging.
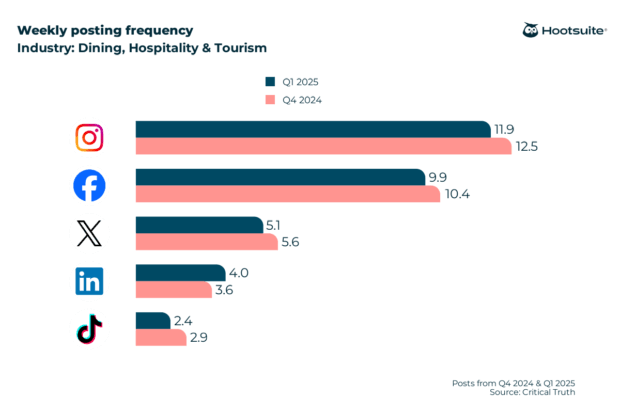
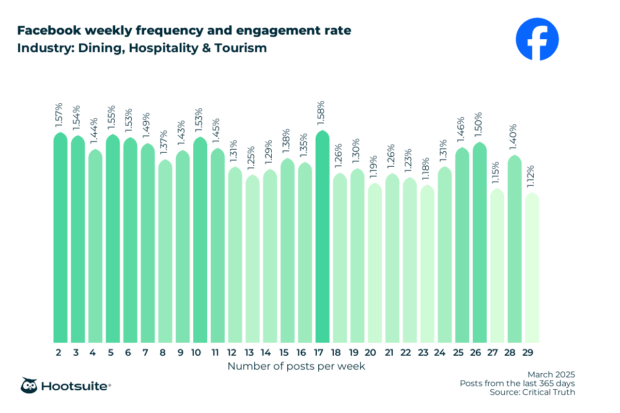
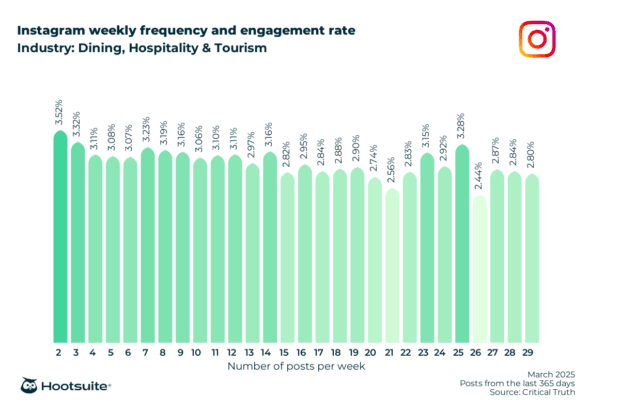
Remarkably, TikTok boasts an astounding 18.75% weekly follower growth rate, positioning it as an unparalleled platform for audience expansion in this sector. Instagram (11.9 posts weekly) and Facebook (9.9 posts weekly) are the most frequently used platforms. However, optimal engagement on Instagram (3.52%) is achieved with just 2 posts per week, suggesting quality over quantity. Facebook sees peak engagement (1.58%) with 17 posts, X (Twitter) with 8 or 10 posts (2.14%), and TikTok with 2 posts (1.36%). The high growth on TikTok combined with lower optimal posting frequency for engagement suggests that viral, high-impact content is key rather than sheer volume.
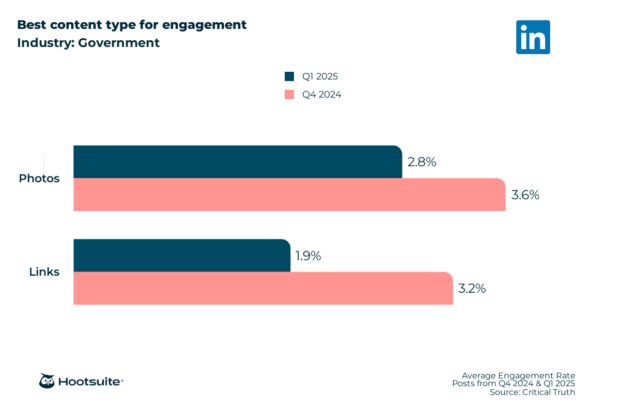
Government-Related Services: Communicating Public Information
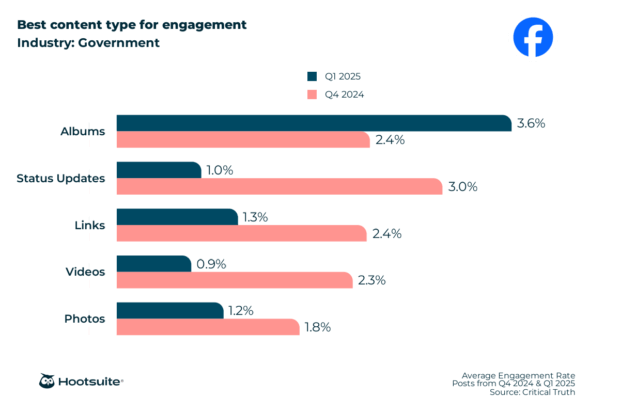
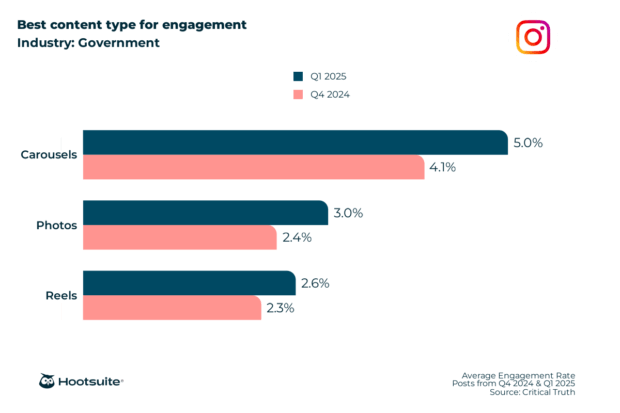
For government entities, clear and accessible communication is key. Facebook albums achieve 3.6% engagement, useful for presenting public initiatives or event recaps. Instagram carousels lead at 5.0%, ideal for conveying multi-step information or public service announcements visually. LinkedIn favors photos with 2.8% engagement, likely for professional updates, policy announcements, or leadership profiles. TikTok focuses on videos at 1.6% engagement, for more digestible public awareness campaigns. X (Twitter) sees status updates performing best at 1.8%, serving as a primary channel for real-time updates and public discourse.
Instagram demonstrates the highest weekly follower growth at 2.17%, suggesting visual and direct communication resonates with citizens. Government agencies post most frequently on Facebook (16.1 times weekly). Optimal engagement on Facebook (2.32%), LinkedIn (2.80%), and X (Twitter) (2.03%) is consistently achieved with a low frequency of 2 or 3 posts per week. This suggests that while maintaining a frequent presence on Facebook is common, more impactful, less frequent posts drive higher interaction.
Healthcare Industry: Trust, Information, and Community
The healthcare sector often grapples with complex information and the need to build trust. Facebook albums are effective with 3.8% engagement, potentially for hospital tours, patient stories, or health campaign summaries. Instagram carousels lead at 4.5%, providing an excellent format for health tips, myth-busting, or multi-slide explanations. LinkedIn prioritizes photos with 3.4% engagement, for professional updates, research highlights, or staff recognition. TikTok’s videos generate 1.0% engagement, for quick health facts or awareness. X (Twitter) finds success with status updates at 2.3%, for breaking news, public health alerts, or quick Q&As.
Remarkably, Facebook boasts the highest weekly follower growth at 10.11%, indicating its continued importance for community engagement and public health information dissemination. The industry posts most on Facebook (11.4 times weekly). However, optimal engagement on Facebook (2.22%) and Instagram (3.89%) is achieved with just 2 posts per week. LinkedIn shows highest engagement (3.61%) with 20 posts, X (Twitter) with 28 posts (2.65%), and TikTok with 7 posts (1.03%). This suggests that while Instagram and Facebook benefit from quality over quantity, LinkedIn and X (Twitter) audiences in healthcare appreciate a more frequent, informative presence.
Real Estate, Legal, & Professional Services: Expertise and Visuals
These professional industries rely on demonstrating expertise and often showcasing tangible assets. Facebook albums perform best at 2.9%, ideal for property listings, client testimonials, or team photos. Instagram carousels lead at 4.1%, perfect for property tours, before-and-after legal case studies, or multi-tip professional advice. LinkedIn’s strength lies in videos (4.0% engagement), for expert interviews, market analyses, or firm profiles.
TikTok shows the highest weekly follower growth at 1.62%, suggesting an untapped potential for these traditionally conservative industries to reach new demographics with engaging, short-form content. These industries post most on Facebook (11.6 times weekly) and X (Twitter) (10.2 times weekly). Optimal engagement on Facebook (2.09%), Instagram (4.23%), and LinkedIn (3.36%) is consistently achieved with just 2 posts per week. X (Twitter) performs best with 3 posts (1.88%), and TikTok with 3 posts (0.95%). This points to a clear preference for curated, high-value content over high volume on most platforms.
Retail Industry: Showcasing Products and Lifestyle
The retail sector thrives on visual merchandising and direct customer appeal. Facebook albums perform best at 1.9%, for product launches, seasonal collections, or lifestyle shots. Instagram carousels lead at 3.6%, allowing for detailed product views, style guides, or user-generated content features. LinkedIn’s focus is on videos with 4.3% engagement, likely for corporate news, brand stories, or recruitment. TikTok’s videos achieve 1.6% engagement, perfect for product demonstrations, trends, or user challenges. X (Twitter) values status updates at 1.7%, for promotions, customer service, or quick announcements.
Facebook shows the highest weekly follower growth at 2.43%, indicating its continued relevance for building a loyal customer base. The retail industry posts most on Facebook (9.0 times weekly). However, optimal engagement on Facebook (1.54%) is achieved with 18 posts per week, suggesting a need for constant visibility. Instagram sees highest engagement (3.66%) with 25 posts, LinkedIn with 15 posts (4.15%), X (Twitter) with 8 posts (1.88%), and TikTok with 4 or 5 posts (1.74%). This implies that retail audiences generally expect and respond well to a high volume of engaging content, particularly on visual platforms.
Construction, Mining, & Manufacturing: Highlighting Innovation and Safety
These industries often focus on large-scale projects and technical expertise. Facebook albums achieve 2.8% engagement, ideal for project updates, equipment showcases, or safety campaigns. Instagram carousels lead at 5.2%, for step-by-step process explanations, equipment details, or team highlights. LinkedIn values videos and photos equally at 4.0%, for corporate news, thought leadership, or recruitment. TikTok’s videos generate 2.6% engagement, for quick glimpses into operations or innovative solutions. X (Twitter) finds success with status updates at 2.4%, for company news, industry trends, or quick project milestones.
TikTok and Instagram both share the highest weekly follower growth at 1.71%, suggesting visual platforms are key for attracting talent and showcasing modern practices. The industry posts most on Facebook (7.9 times weekly). Optimal engagement on Facebook (2.31%) and X (Twitter) (2.58%) is achieved with just 2 posts per week. Instagram sees highest engagement (5.02%) with 28 posts, LinkedIn with 2 or 20 posts (4.13%), and TikTok with 3 posts (2.60%). This highlights the potential of visual platforms for these industries, but with varying optimal frequencies.
Marketing Agencies: Demonstrating Creativity and Expertise
For marketing agencies, social media is a direct showcase of their capabilities. Facebook albums perform best at 2.2%, perhaps for case studies or event photos. Instagram carousels lead at 3.7%, ideal for presenting data, tips, or portfolio highlights. LinkedIn prioritizes videos with 4.7% engagement, a strong format for thought leadership, client testimonials, or industry analysis. TikTok’s videos generate 0.7% engagement, for creative insights or behind-the-scenes content. X (Twitter) values status updates at 1.7%, for industry news or quick commentary.
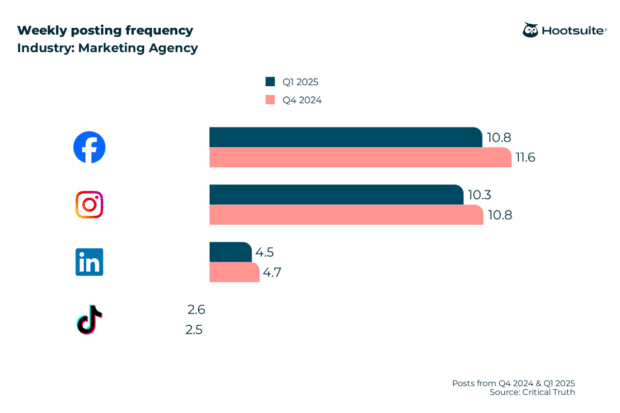
While follower growth varies, agencies post most on Facebook (10.8 times weekly) and Instagram (10.3 times weekly). Optimal engagement on Facebook (2.08%) and Instagram (4.00%) is achieved with just 2 posts per week. LinkedIn sees highest engagement (4.02%) with 19 posts, X (Twitter) with 9 posts (2.09%), and TikTok with 6 posts (0.88%). This suggests that consistent, high-quality, but not necessarily high-volume, content is key for agencies on core platforms.
Nonprofit Industry: Inspiring Action and Community Support
Nonprofits thrive on storytelling and community engagement. Facebook albums lead at 3.0%, for event recaps, beneficiary stories, or volunteer spotlights. Instagram carousels perform best at 5.5%, a powerful format for impact reports, awareness campaigns, or step-by-step calls to action. LinkedIn values photos with 3.4% engagement, for organizational updates or partner recognition. TikTok’s videos generate 1.3% engagement, for short, impactful stories. X (Twitter) finds success with replies at 2.4%, indicating direct engagement with their community.
TikTok demonstrates the highest weekly follower growth at 2.15%, highlighting its potential for reaching new, younger audiences. Nonprofits post most on Facebook (9.5 times weekly). Optimal engagement on Facebook (2.36%) and LinkedIn (3.58%) is achieved with just 2 posts per week. Instagram sees highest engagement (4.95%) with 25 posts, X (Twitter) with 2 or 24 posts (2.44%), and TikTok with 3 posts (1.67%). This indicates a need for high-frequency, visually rich content on Instagram, while other platforms benefit from more measured posting.
Technology Industry: Innovation and Thought Leadership
The technology sector is characterized by rapid innovation and a need to communicate complex ideas. Facebook albums perform best at 1.8%, potentially for event photos or team showcases. Instagram carousels lead at 4.2%, excellent for explaining features, sharing tips, or showcasing product updates. LinkedIn prioritizes videos with 3.9% engagement, for thought leadership, product demos, or corporate announcements. TikTok’s videos generate 0.7% engagement, for quick tech insights or viral trends. X (Twitter) finds success with replies at 2.5%, for customer support or quick interactions.
An astonishing finding is Facebook’s 199.09% weekly follower growth rate, making it an exceptional channel for audience expansion in technology, perhaps through targeted advertising or community building. The industry posts most on Instagram (12.1 times weekly). Optimal engagement on LinkedIn (3.72%) is achieved with 2 posts per week. Facebook sees highest engagement (1.67%) with 25 posts, Instagram with 18 posts (3.57%), X (Twitter) with 19 posts (2.59%), and TikTok with 3 posts (0.74%). This suggests a high volume of content is effective on most platforms, but LinkedIn still values fewer, high-quality posts.
Utilities & Energy: Reliability and Community Engagement
These industries often focus on public service and community safety. Facebook albums perform best at 3.2%, for community updates, safety tips, or infrastructure projects. Instagram carousels lead at 5.5%, excellent for explaining energy-saving tips or community initiatives. LinkedIn values videos and photos equally at 3.4%, for corporate responsibility, industry news, or recruitment. X (Twitter) finds success with status updates at 2.4%, for service alerts or quick updates.
LinkedIn shows the highest weekly follower growth at 1.12%, indicating its importance for professional networking and corporate communications. The industry posts most on Facebook (4.8 times weekly). Optimal engagement on Facebook (2.24%) and Instagram (3.95%) is achieved with just 2 posts per week. LinkedIn sees highest engagement (3.74%) with 10 posts, X (Twitter) with 10 posts (2.60%), and TikTok with 5 posts (0.85%). This suggests that a measured, informative approach is often best for engaging these audiences.
Overall Trends: A Panoramic View of Social Media Performance
Across all industries, several general trends emerge:
- Facebook: Albums consistently perform best (2.9% engagement), indicating a preference for visual storytelling. The optimal posting frequency for engagement is typically low, around 2 posts per week (2.08% engagement), suggesting quality over quantity is often key.
- Instagram: Carousels are the top content type (4.2% engagement), highlighting the effectiveness of interactive, multi-slide visuals. Similar to Facebook, optimal engagement is often achieved with 2 posts per week (4.04% engagement), despite some industries seeing success with higher volumes.
- LinkedIn: Videos lead in engagement (3.9%), underscoring the platform’s shift towards dynamic professional content. The highest engagement rate is also found with a low frequency of 2 posts per week (3.56% engagement).
- TikTok: Videos are the undisputed champion (1.5% engagement), aligning with its core offering. Its overall highest engagement is seen with 14 posts per week (1.71%), pointing to the platform’s demand for high-frequency content.
- X (Twitter): Status updates are generally the most engaging (1.8%), reflecting its text-first, real-time nature. Optimal engagement is typically achieved with 2 posts per week (2.21%), despite many industries posting significantly more.
In terms of follower growth, TikTok stands out with an overall weekly growth rate of 197.37%, indicating its explosive potential for audience expansion across various sectors, though the high growth in Technology’s Facebook cannot be overlooked. Overall, industries post most frequently on X (Twitter), averaging 18.1 times a week, reflecting its rapid-fire communication style.
Strategic Implications for Optimized Social Media Engagement
These benchmarks are more than just statistics; they are powerful strategic tools.
-
Contextual Performance Evaluation: Tracking internal metrics alone provides an incomplete picture. Benchmarks offer the external context needed to truly understand performance. For instance, a seemingly slow growth rate might actually exceed competitor performance, or a satisfactory engagement rate could reveal significant room for improvement after a competitive analysis. This external validation is crucial for demonstrating the tangible value of social media efforts to clients and stakeholders and can justify requests for additional resources or strategic shifts. It also serves as a factual counterpoint to unrealistic demands, such as the often-heard "make a viral video."
-
Setting Realistic and Attainable Goals: Benchmarks are foundational for establishing SMART goals (Specific, Measurable, Achievable, Relevant, Time-bound). By understanding typical industry performance, organizations can set targets that are ambitious enough to drive innovation but grounded in reality, preventing frustration and resource wastage. This prevents setting arbitrary goals that are either too low to inspire or too high to ever achieve.
-
Replicating and Optimizing Winning Strategies: Identifying industry leaders who consistently outperform benchmarks is a strategic goldmine. Through social listening and competitive analysis, brands can reverse-engineer successful strategies. Observing their content types, posting frequencies, and engagement patterns can provide actionable insights. For example, if a competitor consistently achieves higher engagement with carousel posts on Instagram, this suggests an area for experimentation and adaptation within one’s own strategy. It’s about learning from the best and applying those lessons through tailored experimentation.
-
Early Opportunity Spotting: Benchmarks also serve as an early warning system for market shifts. A flat or declining audience growth rate on a traditionally strong platform within a specific industry could signal a need to diversify focus or invest in emerging platforms. Conversely, a rapidly growing platform like TikTok across multiple industries points to a broad opportunity. While benchmarks offer guidance, they are a starting point for continuous A/B testing, experimentation, and strategic bets. The digital landscape is ever-evolving, and a dynamic approach informed by real-time data is essential for sustained success.
In conclusion, the effective utilization of social media benchmarks transforms abstract performance numbers into actionable intelligence. By providing a clear picture of industry norms, these benchmarks empower brands to refine their content strategies, optimize posting schedules, allocate resources more effectively, and ultimately, drive more meaningful engagement and growth in a competitive digital world. The emphasis remains on continuous monitoring and agile adaptation, ensuring that social media efforts are not just visible, but truly impactful.


