The 5 Most Important Metrics for Success
The 5 most important metrics for success are the cornerstone of any thriving business or project. Understanding these key performance indicators (KPIs) is crucial for effective decision-making and achieving desired outcomes. From tracking website traffic to measuring customer satisfaction, these metrics provide a clear picture of your progress and highlight areas needing attention.
This comprehensive guide delves into the definition, identification, and application of these critical metrics across various industries, including software development, marketing, and retail. We’ll explore how to leverage these metrics to drive improvement, enhance performance, and ultimately, achieve your goals.
Defining Metrics: The 5 Most Important Metrics
Metrics are the quantitative measures used to track progress, assess performance, and make informed decisions across various domains. They provide a numerical representation of key aspects of a process, project, or business, offering valuable insights into trends and effectiveness. From evaluating project milestones to monitoring financial health, metrics are crucial for understanding the current state and guiding future strategies.Effective metrics are more than just numbers; they provide actionable insights.
They are carefully designed to reflect the most pertinent aspects of a process or activity, enabling adjustments and improvements. The selection and interpretation of metrics directly influence the outcomes and direction of an organization or project.
Characteristics of Effective Metrics
Effective metrics possess several key characteristics. They must be measurable, ensuring accurate and consistent tracking. Relevance is critical; the metric should directly reflect the objectives and goals being pursued. Actionability means the metric’s data can be used to drive decisions and improvements. Finally, a metric must be timely, updated frequently enough to provide a current and accurate picture of performance.
Consistency in measurement methods is also crucial for accurate comparisons over time.
Metrics vs. KPIs
Metrics are broader quantitative measurements, while Key Performance Indicators (KPIs) are specific metrics selected to track progress towards strategic objectives. KPIs are chosen from a wider range of metrics based on their direct impact on achieving specific goals. For example, website traffic is a metric, but conversion rate is a KPI for an e-commerce site, directly related to revenue generation.
Figuring out the 5 most important metrics for your business can be tricky, but understanding how to use A/B testing is key. To get inspired, check out these 10 best A/B test examples you must try yourself here. Ultimately, the best metrics will depend on your specific goals, but keeping an eye on key performance indicators like conversion rates and click-through rates will help you measure your success and optimize your strategy.
Examples of Metrics in Different Industries
Metrics are widely used across various industries. In e-commerce, metrics like conversion rates, average order value, and customer lifetime value help businesses understand customer behavior and optimize sales strategies. Software development uses metrics like defect density, code coverage, and release cycle time to ensure software quality and efficiency. Healthcare leverages metrics such as patient satisfaction scores, readmission rates, and hospital-acquired infection rates to improve patient outcomes and quality of care.
Types of Metrics and Applications
| Metric Type | Description | Application | Example |
|---|---|---|---|
| Performance Metrics | Measure the success of a process or activity. | Business operations, project management | Customer satisfaction score, project completion rate |
| Financial Metrics | Measure financial performance. | Finance, accounting | Revenue, profit margin, return on investment (ROI) |
| Operational Metrics | Measure the efficiency and effectiveness of internal processes. | Manufacturing, logistics | Production output per hour, order fulfillment time |
| Quality Metrics | Measure the quality of products or services. | Manufacturing, customer service | Defect rate, customer complaint rate |
Identifying Important Metrics
Choosing the right metrics is crucial for gauging success and making informed decisions in any project or business endeavor. Metrics provide a quantifiable way to track progress, identify areas for improvement, and ultimately, achieve desired outcomes. A well-defined set of metrics allows for objective evaluation and helps in steering strategies toward greater efficiency and effectiveness.Understanding the specific metrics relevant to the context is key.
Different industries and project types have distinct success factors, requiring tailored sets of metrics. For instance, a software development project might prioritize code quality and delivery time, while a retail store might focus on customer satisfaction and sales conversion rates. The key is to align metrics with the specific goals and objectives of the endeavor.
Software Development Project Metrics
Successful software development hinges on a combination of factors. Crucial metrics for evaluating project success include:
- Project Completion Rate: This metric tracks the percentage of planned tasks or features completed against the project schedule. High completion rates demonstrate efficient project management and adherence to timelines. A 95% completion rate in the first quarter of a project, for example, suggests a healthy trajectory. It also indicates if the project is likely to finish on time and within budget.
- Defect Rate: This metric quantifies the number of defects found in the software during testing and development phases. A low defect rate signifies high quality and careful attention to detail. A defect rate of 1 per 1,000 lines of code demonstrates a commitment to high-quality software development.
- Time to Market: This metric measures the time taken to release a software product or feature to the users. Faster time to market can translate to quicker revenue generation and a stronger competitive edge. A software company achieving a time to market of 3 months for a new feature compared to 6 months for a competitor could gain a significant market advantage.
- Customer Satisfaction: Feedback from users provides valuable insights into the software’s usability and functionality. High customer satisfaction ratings demonstrate a well-received product. Customer satisfaction surveys and feedback mechanisms can quantify this aspect.
- Development Team Productivity: This metric assesses the output of the development team in terms of features completed per developer or team, per unit of time. High productivity signifies efficient use of resources. Tracking output per developer in terms of lines of code, or features developed per week, can highlight productivity issues or areas for improvement.
Website Traffic and User Engagement Metrics
Analyzing website traffic and user engagement is essential for understanding how users interact with a website. Key metrics include:
- Unique Visitors: This metric tracks the number of unique individuals who visit a website within a specific period. High unique visitor counts indicate strong website reach and popularity. 10,000 unique visitors per month for a website selling handmade jewelry suggests significant visibility and customer base.
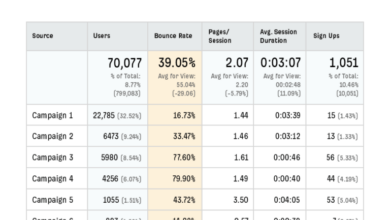
- Bounce Rate: This metric indicates the percentage of visitors who leave a website after viewing only one page. A low bounce rate suggests users find the website engaging and informative. A bounce rate below 40% demonstrates a positive user experience.
- Average Session Duration: This metric measures the average time spent by users on a website during a visit. Longer session durations typically indicate greater user engagement and interest. Average session duration of 10 minutes for an online learning platform suggests the material is well-received.
- Conversion Rate: This metric measures the percentage of website visitors who complete a desired action, such as making a purchase or filling out a form. High conversion rates indicate effective website design and persuasive calls to action. A conversion rate of 5% for a landing page focused on lead generation is considered good.
- Page Views per Visit: This metric tracks the number of pages visited by a user during a single session. Higher page views per visit indicate that users are exploring the site thoroughly. High page views per visit can be a good indicator of site quality.
Marketing Campaign Efficiency Metrics
Evaluating marketing campaign effectiveness is vital for optimizing future strategies. Key metrics include:
- Return on Investment (ROI): This metric assesses the profitability of a marketing campaign by comparing the revenue generated to the cost of the campaign. High ROI signifies effective marketing strategies. An ROI of 5:1 means for every $1 invested in the campaign, $5 are generated in return.
- Lead Generation Rate: This metric tracks the number of qualified leads generated by a marketing campaign. High lead generation rates demonstrate the campaign’s ability to attract potential customers. Generating 100 qualified leads per month from a social media campaign is a positive sign.
- Customer Acquisition Cost (CAC): This metric measures the cost of acquiring a new customer through marketing efforts. Lower CAC values indicate more efficient marketing campaigns. A CAC of $50 per customer suggests the marketing strategy is cost-effective.
- Brand Awareness: This metric tracks the recognition and recall of a brand. Brand awareness can be measured through surveys or social media engagement. A notable increase in brand mentions on social media platforms suggests increased brand awareness.
- Click-Through Rate (CTR): This metric measures the percentage of people who click on a specific advertisement or link. High CTR indicates that the marketing message is effective and engaging. A CTR of 5% on an email campaign suggests the subject line and content are compelling.
Retail Customer Satisfaction Metrics
Understanding customer satisfaction in a retail setting is crucial for building loyalty and driving repeat business. Key metrics include:
- Customer Satisfaction Score (CSAT): This metric gauges customer satisfaction levels through surveys or feedback forms. High CSAT scores reflect positive customer experiences. A CSAT score of 4.5 out of 5 indicates a high level of customer satisfaction.
- Net Promoter Score (NPS): This metric measures customer loyalty and willingness to recommend a company. High NPS scores indicate strong customer relationships. An NPS of 70 signifies a strong customer base.
- Customer Retention Rate: This metric tracks the percentage of customers who return to a retail store or make repeat purchases. A high retention rate signifies customer loyalty and satisfaction. A retention rate of 80% demonstrates that a significant proportion of customers return.
- Customer Effort Score (CES): This metric measures the ease with which customers can resolve issues or obtain assistance. Low CES scores reflect a positive customer service experience. A CES score below 2.5 indicates that customers find it easy to get help.
- Customer Lifetime Value (CLTV): This metric assesses the total revenue a customer is expected to generate throughout their relationship with the company. High CLTV values indicate a valuable customer base. A CLTV of $1,000 per customer suggests a high-value customer relationship.
Comparing Metrics Across Industries
The importance of various metrics can differ significantly across industries. While project completion rate and defect rate are crucial in software development, customer acquisition cost and brand awareness are more important for marketing campaigns. Retail businesses may prioritize customer satisfaction scores and customer lifetime value. Analyzing metrics in context is essential to draw meaningful conclusions.
| Metric | Description | Potential Impact |
|---|---|---|
| Project Completion Rate | Percentage of tasks completed on schedule | Impacts project timeline, budget, and overall success |
| Defect Rate | Number of defects found in software | Affects software quality, user experience, and potential bugs |
| Unique Visitors | Number of individuals visiting a website | Indicates website popularity and reach |
| Conversion Rate | Percentage of visitors completing desired action | Impacts sales, lead generation, and website effectiveness |
| Customer Satisfaction Score (CSAT) | Customer satisfaction level | Reflects customer experience, loyalty, and brand perception |
Importance and Application of Metrics
Unlocking the power of data is crucial for any business aiming to thrive in today’s competitive landscape. Metrics serve as the compass, guiding decision-making and ensuring that actions align with strategic objectives. By meticulously tracking key performance indicators (KPIs), businesses can identify areas of strength and weakness, fostering continuous improvement and ultimately driving success. This section delves into the significance of these metrics, outlining practical application strategies, and providing actionable steps for implementation.
Pinpointing the 5 most crucial metrics for website optimization is key. Understanding how search engines crawl and index your site is essential. For example, a deep dive into search engine friendly pagination, as outlined in the ultimate guide to search engine friendly pagination , will directly impact these metrics. Ultimately, focusing on these 5 key metrics is the best way to ensure a strong SEO strategy.
Essential Role of Metrics in Decision-Making
Metrics provide a quantitative framework for understanding business performance. They translate abstract goals into measurable milestones, enabling data-driven decision-making. For instance, a company aiming to increase customer satisfaction can track customer feedback scores, allowing them to identify areas for improvement in service quality. Analyzing these metrics empowers businesses to make informed choices, allocate resources effectively, and optimize processes for maximum impact.
Effective Use of Metrics to Improve Performance
Implementing metrics effectively requires a proactive approach. Businesses should align metrics with strategic objectives, ensuring that measurements directly support the company’s overall goals. This alignment guarantees that efforts are focused on achieving meaningful outcomes. For example, if the objective is to increase sales by 15%, metrics should focus on sales figures, conversion rates, and customer acquisition costs.
Implementing Metrics into Business Processes
Integrating metrics into business processes necessitates a systematic approach. First, identify the relevant metrics that align with the company’s objectives. Next, establish clear procedures for data collection, ensuring accuracy and consistency. Finally, create a system for regular reporting and analysis to track progress and identify potential issues. This systematic approach ensures metrics are not just tracked, but actively utilized to drive improvements.
Tracking Progress Towards Objectives, The 5 most important metrics
Tracking progress toward objectives requires consistent monitoring and analysis of the collected data. By comparing current performance metrics to previous data or predefined targets, businesses can identify deviations and implement corrective actions. For example, if sales figures are falling short of the projected target, the company can investigate the reasons behind the decline, such as competitor actions, market fluctuations, or internal inefficiencies.
Adjusting strategies based on these insights ensures that objectives remain within reach.
Data Collection and Analysis Procedure
A structured approach to data collection and analysis is paramount for reliable insights. The process typically involves:
- Defining the specific metric to be measured. Clearly articulate the parameter that needs to be tracked. For example, to measure customer satisfaction, define the specific questions to be included in the survey.
- Determining the data source. Identify the sources from which the data will be collected, whether it’s customer feedback surveys, sales records, or website analytics.
- Establishing a consistent data collection method. Ensure that the data is gathered using a standardized method, ensuring accuracy and comparability across different time periods.
- Regularly collecting and recording the data. Establish a routine for data collection, ensuring that the data is recorded promptly and accurately.
- Analyzing the collected data to identify trends and patterns. Utilize appropriate analytical tools to identify trends, patterns, and correlations in the data.
- Using insights to make data-driven decisions. Based on the analysis, implement adjustments to processes or strategies to improve performance.
Methods for Measuring Each Metric
| Metric | Measurement Method | Tools |
|---|---|---|
| Customer Satisfaction | Surveys, focus groups, customer feedback forms | SurveyMonkey, Qualtrics, online feedback forms |
| Sales Revenue | Sales reports, CRM data | Salesforce, HubSpot, Excel |
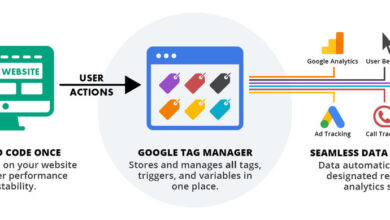
| Website Traffic | Website analytics platforms | Google Analytics, Adobe Analytics |
| Customer Acquisition Cost (CAC) | Divide total marketing spend by the number of new customers acquired | Spreadsheet software, marketing automation platforms |
| Conversion Rate | Divide the number of conversions by the total number of visitors | Website analytics platforms, marketing automation platforms |
Illustrative Examples and Case Studies
Understanding the practical application of key metrics is crucial for any business looking to optimize its performance. Real-world examples demonstrate how specific metrics can be leveraged to drive positive change, from boosting profitability to enhancing customer satisfaction. This section will delve into case studies highlighting the impact of these metrics on different organizations.Analyzing successful strategies provides valuable insights for businesses to tailor their approach to achieving their goals.
The use of data-driven decision-making, as exemplified in the case studies below, is paramount for organizations aiming for long-term success.
Focusing on the 5 most important metrics is crucial for any blog’s success. While having a separate subdomain blog might seem appealing, it often doesn’t translate into improved search engine rankings. In fact, blogs on subdomains are basically worthless for SEO, as explained in more detail here: why blogs on subdomains are basically worthless for seo.
Ultimately, mastering those key metrics remains the priority for driving organic traffic and achieving your blog goals.
A Retail Company’s Profitability Improvement
A mid-sized retail company, “Trendsetters,” noticed declining profitability despite increased sales volume. They identified five key metrics: customer acquisition cost (CAC), average order value (AOV), customer lifetime value (CLTV), return on ad spend (ROAS), and inventory turnover rate. By analyzing these metrics, they discovered a high CAC and low AOV, indicating inefficient marketing campaigns and low customer engagement.
Trendsetters implemented targeted advertising campaigns focusing on higher-value customer segments, resulting in a 20% reduction in CAC and a 15% increase in AOV. They also improved inventory management, boosting inventory turnover and reducing holding costs. These combined improvements led to a 10% increase in overall profitability within six months.
Improving Customer Satisfaction at a Software Company
“TechSolutions,” a software company, experienced declining customer satisfaction ratings. They identified customer support response time, feature usage rates, and customer feedback as key metrics. Analyzing these metrics revealed that long support response times were a major contributor to customer dissatisfaction. TechSolutions invested in enhanced customer support infrastructure, increasing the number of support agents and implementing a self-service portal.
This resulted in a 30% reduction in average response time and a 15% increase in feature usage rates. The company also implemented a system for actively collecting and analyzing customer feedback, leading to improved product development and enhanced customer experience. Consequently, customer satisfaction ratings increased by 10% within the next quarter.
Metrics in a Successful Product Launch
A technology startup, “InnovateTech,” launched a new software product. They tracked key metrics like website traffic, lead generation, conversion rates, and customer acquisition cost. These metrics were crucial in understanding the product’s market reception. By monitoring website traffic, they identified popular features and areas needing improvement. The company leveraged this information to refine the product based on user feedback.
This data-driven approach to product development, along with effective marketing campaigns, resulted in exceeding initial sales projections by 25%. A high conversion rate from leads to customers indicated a successful sales strategy.
Summary of Case Studies
| Case Study | Key Metrics | Results |
|---|---|---|
| Trendsetters (Retail) | CAC, AOV, CLTV, ROAS, Inventory Turnover | 10% increase in profitability within 6 months |
| TechSolutions (Software) | Customer support response time, feature usage rates, customer feedback | 10% increase in customer satisfaction ratings |
| InnovateTech (Technology) | Website traffic, lead generation, conversion rates, CAC | 25% increase in initial sales projections |
Future Trends and Developments

The landscape of metric measurement and analysis is rapidly evolving, driven by technological advancements. This evolution demands a proactive approach to adapt and leverage these changes to gain deeper insights and make more informed decisions. Understanding the future trends in data collection, interpretation, and analysis is critical for organizations to maintain a competitive edge.The shift towards real-time data and the increasing complexity of data sources require new methodologies for collecting, processing, and interpreting metrics.
The focus is moving beyond simple dashboards to more sophisticated data visualization and predictive modeling techniques, enabled by the growing power of artificial intelligence and machine learning.
Forecasting Future Trends in Metric Measurement and Analysis
Predicting future trends in metric measurement and analysis necessitates understanding the driving forces behind these changes. The ongoing digital transformation is fundamentally altering how businesses operate, and consequently, how they measure success. This necessitates a shift from traditional, static metrics to dynamic, real-time indicators that reflect the ever-changing business environment. Furthermore, the rise of interconnected data sources (e.g., IoT devices, social media platforms) is creating a need for more sophisticated data integration and analysis tools.
Technology’s Impact on Metric Collection and Interpretation
Technological advancements are revolutionizing how metrics are collected and interpreted. Real-time data streams from various sources, including IoT devices and online platforms, provide an unprecedented opportunity to track performance in dynamic environments. This abundance of data requires robust data management systems and advanced analytical tools. Cloud-based platforms and distributed computing are enabling faster processing and analysis of massive datasets, unlocking deeper insights previously unattainable.
The Role of Data Visualization in Understanding Metrics
Effective data visualization is crucial for translating complex data into actionable insights. Interactive dashboards and dynamic visualizations allow users to explore metrics across various dimensions, identify trends, and uncover patterns that might otherwise be missed. Visual representations of data make complex information more accessible and understandable, enabling stakeholders to make data-driven decisions. Advanced visualization techniques, such as interactive maps and heatmaps, provide a more nuanced understanding of data.
AI and Machine Learning in Metric Analysis
Artificial intelligence (AI) and machine learning (ML) are transforming how metrics are analyzed. AI algorithms can identify patterns and anomalies in large datasets, forecast future trends, and automate routine tasks. This automation frees up analysts to focus on higher-level strategic insights. For instance, AI-powered anomaly detection systems can flag unusual spikes or dips in key performance indicators (KPIs), allowing for prompt investigation and corrective action.
Adapting Existing Metrics to New Technological Advancements
To maintain relevance, existing metrics need to be adapted to reflect the changes brought about by technological advancements. Traditional metrics might need to be augmented or replaced with new indicators that capture the evolving business landscape. For example, engagement metrics on social media platforms may need to be incorporated into existing marketing campaign performance metrics.
Future Developments in Metric Analysis
| Trend | Description | Impact ||—|—|—|| Real-time Metric Monitoring | Continuous tracking and analysis of data streams. | Improved agility in response to changing conditions, quicker identification of anomalies. || AI-Powered Predictive Analytics | Using AI algorithms to forecast future trends and performance. | Proactive decision-making, optimized resource allocation, improved risk management. || Data Integration and Interoperability | Combining data from various sources for a holistic view of performance.
| Enhanced insights from a more comprehensive perspective, reduction in data silos. || Explainable AI (XAI) | Developing AI models that provide understandable explanations for their predictions. | Increased trust and transparency in AI-driven insights, more effective communication of results. || Augmented Data Visualization | Interactive, immersive visualization tools for exploring and understanding complex data. | Improved data exploration, quicker identification of patterns, increased user engagement.
|
Final Wrap-Up

In conclusion, the 5 most important metrics, when properly understood and implemented, can be a powerful catalyst for success. By analyzing data, adjusting strategies, and consistently tracking performance, businesses can achieve remarkable growth and optimize their operations. Remember that these metrics are not static; they require constant monitoring, adaptation, and refinement to remain relevant in a dynamic environment.