Split Test YouTube Thumbnails Maximizing Views
Split test YouTube thumbnails are crucial for boosting video views and engagement. This guide dives deep into the world of A/B testing, exploring how to design, implement, and analyze thumbnail variations to optimize your YouTube channel’s performance. Understanding the impact of different visual elements, from colors and fonts to imagery and calls to action, is key to crafting compelling thumbnails that entice viewers to click and watch.
From identifying the right metrics to track, like click-through rates and watch time, to understanding advanced techniques like multivariate testing, this comprehensive guide provides practical strategies and real-world examples. We’ll explore how to effectively analyze results and refine thumbnail designs for optimal outcomes.
Introduction to YouTube Thumbnail Split Testing
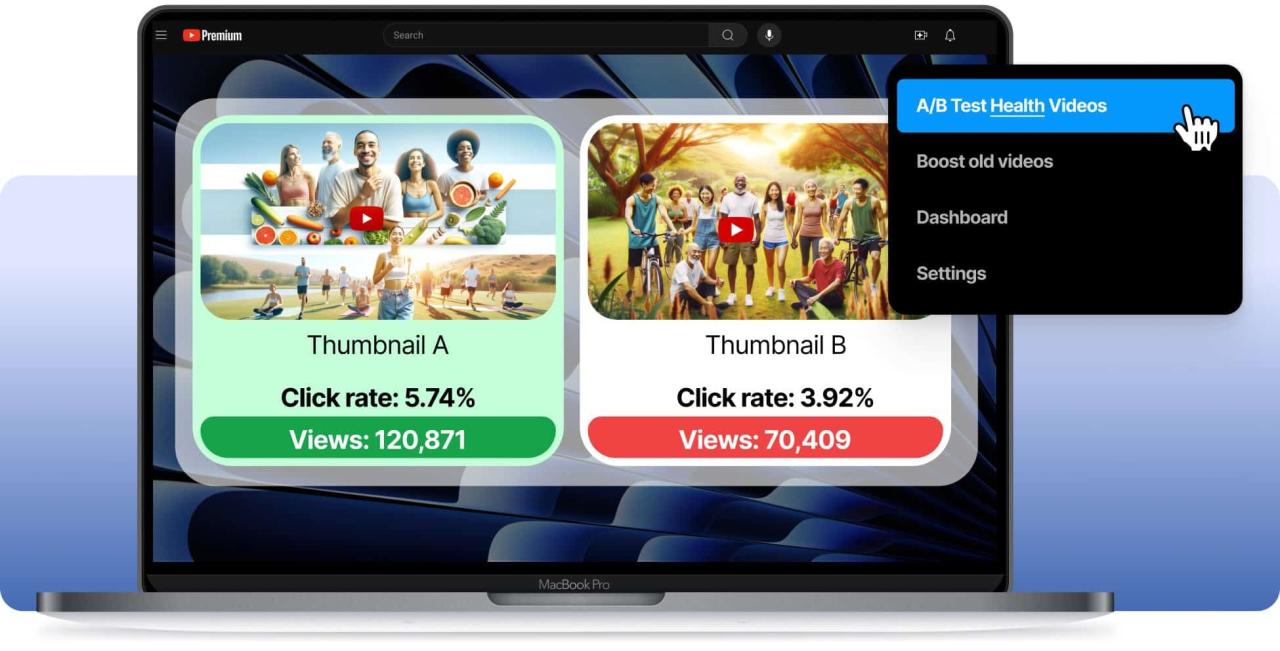
YouTube thumbnail split testing is a crucial strategy for optimizing video performance. It involves creating multiple versions of a thumbnail and presenting them to different segments of your audience to determine which performs best in driving clicks and views. This data-driven approach allows you to identify the most compelling visual elements that resonate with your target audience.Split testing thumbnails goes beyond simply choosing an aesthetically pleasing image.
It’s a process of experimentation and refinement, leading to significantly higher engagement rates. By analyzing click-through rates (CTRs) and view counts, you can identify the winning thumbnail that resonates most effectively with your audience, ultimately leading to increased visibility and growth on YouTube.
Importance of Thumbnails in YouTube
Thumbnails are the first visual impression viewers have of your video. They play a critical role in attracting attention and encouraging clicks. A captivating thumbnail can significantly impact viewership and engagement, while a poorly designed one can deter potential viewers. The thumbnail acts as a mini-trailer, conveying the essence of the video content. Effective thumbnails directly influence the decision of a viewer to click and watch your video.
Different Types of YouTube Thumbnails and Their Effectiveness
Various thumbnail types cater to different video styles and target audiences. Understanding their effectiveness is key to maximizing results.
- Descriptive Thumbnails: These thumbnails clearly convey the video’s content, using text or icons to highlight key information. They are beneficial for educational or informative videos, where clarity and accuracy are crucial.
- Intriguing Thumbnails: These thumbnails aim to pique viewer curiosity, often using suspenseful imagery or questions to entice clicks. They work best for videos with compelling narratives or surprising content.
- Engaging Thumbnails: These thumbnails showcase the video’s most exciting or entertaining aspects. They utilize action-oriented imagery, or elements that highlight the video’s entertainment value. These are suitable for tutorial videos, comedy sketches, or how-to videos.
- High-Quality Thumbnails: Clear, sharp, and well-lit images are essential for showcasing your video’s visual appeal. Investing in high-quality images significantly impacts viewer perception. They enhance the professionalism and value of your video.
Successful Split Testing Strategies for YouTube Thumbnails
Successful split testing hinges on a structured approach and data analysis. It’s not a random process. A strategy is essential for drawing meaningful conclusions.
- Identifying Key Variables: Focus on specific elements of your thumbnails, such as colors, fonts, imagery, and text. Testing variations of these elements will help pinpoint the winning combination.
- Creating Multiple Variations: Develop multiple thumbnail designs that reflect different aspects of your video’s content. For example, one thumbnail could focus on the benefits, while another highlights the problem it solves.
- Analyzing Data Thoroughly: Track click-through rates (CTRs) and view counts for each thumbnail variation. This data provides insights into which thumbnails are most effective in driving engagement.
- Iterative Improvement: Continuously refine your thumbnails based on the data collected. Adapt your designs based on what resonates most with your audience. This iterative process will help you optimize your thumbnail strategy over time.
Example of Split Testing
Imagine a tutorial video on how to bake a cake. One thumbnail features a close-up of the finished, delicious-looking cake, while another showcases the ingredients in a vibrant, appetizing arrangement. Testing these two variations can reveal which thumbnail resonates more with potential viewers, leading to higher click-through rates. If the ingredient-focused thumbnail performs better, it suggests viewers are more interested in the process.
Choosing Metrics for Split Testing: Split Test Youtube Thumbnails
Deciding which metrics to track when split testing YouTube thumbnails is crucial for understanding what resonates best with your audience. Effective metrics provide quantifiable insights into viewer behavior, allowing you to refine your thumbnail strategy and maximize engagement. This involves more than just looking at click-through rates; a holistic approach considers various engagement factors. By understanding how to accurately measure these metrics, you gain a deeper understanding of your content’s performance.Understanding the nuances of viewer response to different thumbnail designs is paramount.
Tracking various metrics allows you to assess the impact of specific design elements and refine your strategy for optimal results. This data-driven approach ensures your thumbnails attract the right viewers and maximize the reach of your videos.
Key Metrics for YouTube Thumbnail Split Testing
Analyzing viewer behavior through various metrics allows you to identify which thumbnail variations are most effective. Tracking these metrics provides valuable insights for optimizing future thumbnail designs.
- Click-Through Rate (CTR): CTR is a fundamental metric for measuring the success of your thumbnails. It represents the percentage of viewers who click on your thumbnail after seeing it. A higher CTR signifies that your thumbnail design is compelling enough to entice viewers to click and watch the video.
- Effective CTR Measurement: Accurately measuring CTR involves tracking the number of impressions (times your thumbnail is displayed) and the number of clicks generated. Tools like YouTube Analytics and third-party analytics platforms can provide detailed CTR data. You should consistently track this metric over time to understand trends and make adjustments as needed. For example, a sudden drop in CTR might indicate a need to refresh your thumbnail strategy.
Calculating View Counts and Engagement Rates
Accurate calculation of view counts and engagement rates is essential for assessing the effectiveness of different thumbnail variations. This data allows for a detailed understanding of the viewer response to each thumbnail design.
- View Counts: YouTube Analytics provides a straightforward method for tracking view counts for each thumbnail variation. Simply analyze the view counts for each test group to identify which thumbnails are attracting more views.
- Engagement Rates: Engagement rates encompass various interactions like likes, comments, and watch time. Calculate engagement rates by dividing the total engagement metrics (likes, comments, watch time) by the total views for each thumbnail variation. Higher engagement rates suggest a stronger connection with the audience.
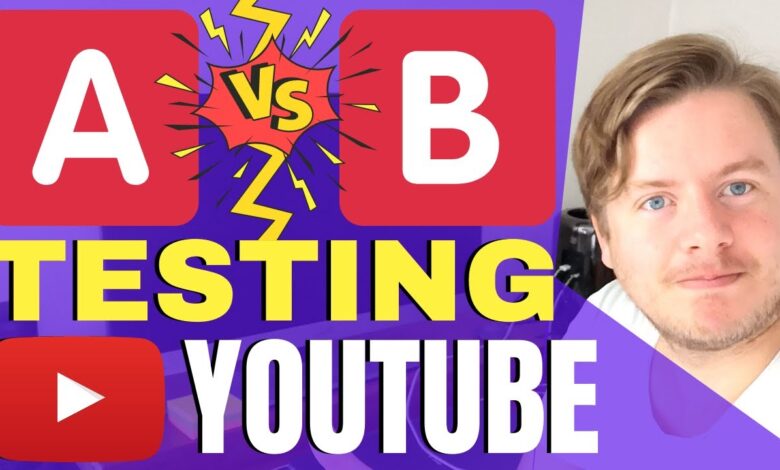
Importance of A/B Testing for Thumbnail Performance Evaluation
A/B testing is a critical tool for evaluating thumbnail performance. By systematically comparing different variations, you can identify which design elements resonate best with your target audience.
- A/B Testing Methodology: A/B testing involves presenting two or more variations of your thumbnail to different segments of your audience. The variation with the highest click-through rate, view count, or engagement rate is deemed more effective.
Examples of Metrics to Monitor
Monitoring specific metrics provides a comprehensive understanding of viewer response to different thumbnail designs. These metrics help in optimizing future thumbnail designs.
- Watch Time: Watch time is a critical metric that reflects viewer engagement with your video. A higher watch time for a particular thumbnail variation indicates a more captivating and relevant thumbnail.
- Comments: Comments reveal insights into viewer feedback and opinions about your videos. Analyzing comments associated with different thumbnail variations helps identify themes and patterns in viewer response.
- Likes: Likes are a straightforward measure of viewer approval and interest in your video. A higher number of likes for a particular thumbnail variation suggests greater appeal to your audience.
Designing Effective Thumbnail Variations
Crafting compelling YouTube thumbnails is crucial for attracting viewers and boosting click-through rates. A well-designed thumbnail acts as a mini-trailer, enticing potential viewers to explore the video’s content. Effective thumbnails use a combination of visual elements and copy to pique interest and accurately reflect the video’s core message.A key aspect of successful thumbnail design is tailoring the visuals to specific audience segments.
By creating variations that resonate with different groups, you can maximize the impact of your thumbnail campaigns and optimize your video reach. This involves understanding your target audience’s preferences and tailoring your design accordingly.
Thumbnail Variation Design Examples
Different thumbnail variations can target different audience segments. Each variation should subtly reflect the video’s content while appealing to the intended audience. Here are three variations, each designed for a distinct viewer group:
| Thumbnail Variation | Target Audience | Expected Results | Design Elements |
|---|---|---|---|
| Variation 1: “Expert Tips” | Viewers seeking in-depth knowledge and practical advice. | Higher click-through rate from viewers interested in comprehensive tutorials. | A professional, clean design featuring a close-up image of a knowledgeable person (e.g., an instructor or speaker). Use sharp, high-quality imagery. The color palette should be sophisticated and trustworthy. Font should be clear and legible. The text should emphasize the expertise or practical application, such as “Mastering [Skill] in 5 Steps.” |
| Variation 2: “Engaging Story” | Viewers drawn to captivating narratives and emotional connections. | Higher engagement from viewers who enjoy emotional or story-driven content. | Emphasize dynamic visual elements and a strong color palette to evoke the video’s mood. Include captivating imagery, such as a dramatic shot or a visually striking scene. The text should focus on intrigue, such as “Unbelievable Transformation.” |
| Variation 3: “Quick Tips & Tricks” | Viewers looking for quick, actionable advice. | Higher click-through rate from viewers seeking instant solutions. | A design that is visually clear and concise. Use a bright and energetic color palette. The image should be a screenshot or graphic showing the main points of the video. Use large, bold fonts for clear text. The text should be direct and actionable, such as “3 Simple Hacks.” |
Color Palette and Imagery
The color palette significantly influences the overall impression of a thumbnail. A vibrant color scheme can attract attention, while a subdued palette may convey professionalism. High-quality images and graphics are essential for creating a professional and engaging thumbnail.
Trying to optimize your YouTube thumbnail game? Split testing different visuals can significantly boost click-through rates. Just like how location extensions in Google Ads can dramatically improve ad performance, as seen in google ad extensions why location extensions have the largest impact on performance , experimenting with various thumbnail styles can yield surprising results. Ultimately, the key to better YouTube engagement still comes down to effective thumbnails that grab attention.
Font Selection and Text
Choosing the right font is crucial for readability and visual appeal. A clear, legible font enhances the thumbnail’s overall design. The text should accurately reflect the video’s content, and effective calls to action can significantly improve click-through rates. Examples include phrases like “Learn More,” “Watch Now,” or “Get Started.”
Tailoring Text for Different Videos
The text used in thumbnails should be tailored to the specific video content. For tutorial videos, emphasize the skills learned. For motivational videos, highlight the benefits and emotional impact. For comedic videos, use humor and intrigue to entice viewers.
“A well-crafted thumbnail acts as a powerful magnet, drawing viewers into the world of your video.”
Implementing Split Testing on YouTube
Successfully implementing split testing on YouTube requires a strategic approach to optimize your thumbnail performance. Understanding the available platforms, tools, and procedures is crucial for effectively executing and analyzing A/B tests. This section will detail the practical steps to create and manage split tests, ensuring a data-driven approach to thumbnail optimization.The key to effective YouTube thumbnail split testing is meticulous planning, execution, and analysis.
By carefully selecting appropriate platforms and tools, crafting compelling thumbnail variations, and employing robust analytical techniques, you can gain valuable insights into what resonates best with your audience. This will enable you to maximize your video’s reach and engagement.
Platforms and Tools for Split Testing
YouTube itself doesn’t directly offer built-in A/B testing for thumbnails. However, various third-party tools and platforms can facilitate this process. Tools like Google Analytics, VWO (Visual Website Optimizer), and Optimizely allow for the creation and tracking of A/B tests across multiple platforms. These tools are capable of tracking user engagement with different thumbnail variations.
Creating and Uploading Thumbnail Variations
Creating diverse thumbnail variations is essential for effective split testing. Variations should focus on elements like color palettes, imagery, text, and overall design. High-quality images and videos are crucial for a visually appealing thumbnail. Consider incorporating different styles or elements to understand how these variations impact audience engagement.
- Creating diverse thumbnail variations: Explore different color palettes, imagery, and text styles. Consider incorporating unique elements or animations. Use high-resolution images and videos for clarity and visual appeal. Example: Test a thumbnail with a vibrant color scheme versus one with a more subdued color palette.
- Uploading thumbnail variations: Ensure that the uploaded thumbnail adheres to YouTube’s guidelines regarding dimensions and file types. Properly label and categorize your variations for easy tracking and identification. Upload thumbnails in the correct format and dimensions. Example: If using a dynamic thumbnail, ensure it’s uploaded correctly.
Setting Up Split Testing Using Analytics Tools
Integrating analytics tools with your YouTube channel is critical for monitoring the performance of different thumbnail variations. This allows you to track crucial metrics like click-through rates (CTR), watch time, and conversions. Utilize the tools’ reporting capabilities to identify trends and patterns in user engagement.
Trying different YouTube thumbnail variations is key for boosting views. A/B testing thumbnails is a split test, and understanding audience engagement through social media listening tools like social media listening tools helps you refine your strategy. By analyzing what resonates most, you can make data-driven choices for future thumbnail designs, ensuring maximum impact.
- Tracking relevant metrics: Focus on key metrics such as click-through rates, watch time, and conversion rates. Establish clear goals and targets for each variation. Analyze the data for each variation. Example: If a variation has a higher CTR, investigate the elements contributing to this increase.
- Analyzing data from analytics tools: Use reports to compare the performance of different thumbnail variations. Look for significant differences in key metrics. Identify patterns and trends. Example: Identify whether a particular color scheme or image consistently drives higher engagement.
Organizing and Managing Split Tests
Effective organization is paramount to managing split tests. Employ a system for labeling and categorizing your thumbnail variations. This enables easy identification and retrieval of data for analysis. A well-structured spreadsheet can aid in organizing data and tracking progress.
- Organizing thumbnail variations: Establish a system for labeling and categorizing your variations. Use a spreadsheet to track the variations, the metrics they are being tested on, and the expected outcome. Example: Create a spreadsheet with columns for variation name, description, target metric, and observed performance.
- Tracking progress and results: Regularly monitor the progress of each split test. Compare results across different variations. Adjust your testing schedule based on the data collected. Example: If a variation performs significantly better than others, allocate more time to test variations similar to that one.
Creating an Effective Testing Schedule
Establishing a structured testing schedule is essential for gathering comprehensive data. A well-planned schedule ensures that you test variations over sufficient periods.
Trying out different YouTube thumbnail designs? Split testing is key! It’s all about A/B testing to see which image gets the most clicks. Want to drive traffic from your Instagram story to your YouTube channel? Learning how to add a link to your Instagram story here is a crucial step in boosting those views.
Ultimately, testing different thumbnails will help you optimize your channel and get more people watching your videos!
- Determining test duration: Consider the duration of your split tests. Longer tests provide more reliable data, while shorter tests can offer quick insights. Example: Test each variation for a minimum of one week, or longer if you have a high volume of views.
- Scheduling and adjusting tests: Plan your tests in advance, considering the time needed for analyzing data and making adjustments. Adapt your schedule based on the results you are observing. Example: If a particular variation is consistently underperforming, you may want to modify it or remove it from testing.
Analyzing and Interpreting Results
Successfully running a split test is only half the battle. The real power lies in understanding the results and using them to refine your YouTube thumbnail strategy. Thorough analysis reveals patterns and trends that guide future design choices, ultimately boosting click-through rates and channel growth.Understanding the nuances of your data is crucial. This involves not just identifying which thumbnail performed better, but alsowhy* it performed better.
Were there specific elements that resonated with your target audience? This knowledge fuels informed decisions, leading to more effective thumbnail designs in the future.
Organizing Data from Split Tests
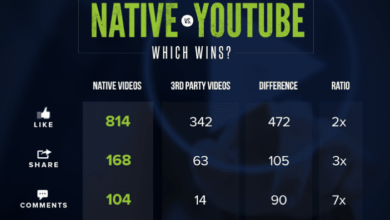
A well-organized table is essential for easily identifying trends. A table should clearly delineate the different thumbnail variations tested, along with key performance indicators (KPIs). This allows for a clear comparison between the various options. Include columns for thumbnail descriptions, impressions, clicks, click-through rate (CTR), and any other relevant metrics.
| Thumbnail Variation | Description | Impressions | Clicks | CTR (%) |
|---|---|---|---|---|
| Variation A | Simple, text-heavy design | 10,000 | 250 | 2.5 |
| Variation B | Intriguing, visual design | 9,500 | 300 | 3.2 |
| Variation C | Animated, engaging design | 10,500 | 280 | 2.7 |
Identifying Key Patterns and Trends
The data in the table provides a starting point. From here, identify clear trends in the collected data. Are certain visual elements consistently driving higher click-through rates? Do specific text styles attract more attention? Are there noticeable differences in performance between different days of the week or times of day?
A careful examination of these patterns provides insights into audience preferences.
Analyzing Differences in Performance
The difference in CTR between thumbnail variations is a key indicator. A 0.7% difference might not seem substantial, but over time, this difference can compound. Calculate the percentage difference between the CTRs of each variation. This allows for a quantifiable assessment of the performance of each thumbnail design.
Interpreting Data and Drawing Conclusions
Interpreting data requires understanding context. Was one thumbnail more successful because of its use of color? Did a different font style lead to higher engagement? Analyzing the data in relation to the specific design elements of each thumbnail is crucial. Correlation doesn’t equal causation, but understanding these relationships will help you refine your designs for optimal results.
Refining Thumbnail Designs
The findings from the split test analysis can be directly applied to future thumbnail design. If a specific visual element consistently performs well, incorporate it into future designs. Conversely, if certain elements consistently underperform, remove or modify them. This iterative process of testing and refinement will improve your thumbnail designs over time. For example, if Variation B consistently performs better, consider incorporating elements of its design, such as a specific color scheme or visual style, into other thumbnails.
Advanced Split Testing Techniques
Pushing beyond simple A/B testing, advanced techniques unlock deeper insights into audience preferences. By simultaneously testing multiple variables, we can understand how different combinations impact engagement. This approach allows for a more nuanced understanding of user behavior and optimizes YouTube thumbnails for maximum impact.Multivariate testing, for example, can reveal which color palettes, fonts, and call-to-actions resonate most strongly. This level of detail significantly improves the chances of creating a truly effective thumbnail that drives desired results.
Furthermore, incorporating user feedback and strategically testing different thumbnail sizes and aspect ratios allows for a highly personalized approach, catering to the specific needs of various viewers.
Multivariate Testing for YouTube Thumbnails
Multivariate testing (MVT) goes beyond A/B testing by evaluating the impact of multiple variables simultaneously. This method allows for a comprehensive understanding of how different combinations of elements in a thumbnail affect user engagement. For instance, an MVT experiment might test different headline fonts, background colors, and call-to-action buttons. Analyzing the results reveals which combinations generate the most clicks and views.
Incorporating User Feedback into Split Testing
Gathering user feedback is crucial for refining thumbnail design. Surveys, polls, and feedback forms provide insights into user preferences. This feedback can inform future split testing experiments, guiding the selection of variables to test and ensuring that thumbnail designs align with viewer expectations. User feedback is an invaluable tool for optimizing thumbnails and driving engagement. Directly integrating user feedback into split testing iterations allows for a highly iterative process that results in a better final product.
Testing Different Thumbnail Sizes and Aspect Ratios
Optimizing thumbnail sizes and aspect ratios is crucial for different video platforms and viewer habits. Different devices, screen resolutions, and video player settings affect how thumbnails are displayed. Conducting tests across various sizes and aspect ratios reveals the most effective visual representation for different audiences. This iterative process helps to identify the optimal thumbnail dimensions that maximize click-through rates across different viewing contexts.
For example, testing thumbnails optimized for mobile devices might reveal higher click-through rates compared to desktop-optimized thumbnails. This would indicate the need to prioritize mobile-friendly designs.
Examples of Successful Multivariate Testing Scenarios for YouTube Thumbnails
A successful example of multivariate testing involved testing different thumbnail sizes (small, medium, and large). Results revealed that medium-sized thumbnails drove the highest click-through rate. This was likely due to the optimized display on different screen sizes and resolutions. Another example involved testing different colors and fonts for the thumbnail text. Results indicated that a combination of bold, contrasting colors and a modern font style resulted in the most significant increase in views.
These results illustrate the value of testing multiple variables to identify the optimal thumbnail design for maximum impact.
Case Studies and Examples
Putting theory into practice is crucial for understanding the effectiveness of split testing. Real-world examples illuminate how different thumbnail designs impact viewer engagement, highlighting strategies that work and those that fall short. Analyzing successful and unsuccessful campaigns provides valuable insights for optimizing your own YouTube thumbnails.Successful split tests demonstrate that a tailored approach, focusing on specific audience segments and content, is often key.
Understanding the subtle nuances of what resonates with viewers allows for targeted improvements in engagement metrics, ultimately driving better results.
Real-World Examples of Successful YouTube Thumbnail Split Tests
These examples showcase how different approaches to thumbnail design can significantly impact click-through rates and viewer engagement.
| Channel/Content | Original Thumbnail | Alternative Thumbnail | Strategy | Outcome | Key Learning |
|---|---|---|---|---|---|
| Tech Review Channel | Generic, product-focused image | Close-up of a key feature, with intriguing question overlay | Emphasized a specific, interesting detail instead of a general overview. | 25% increase in click-through rate, 15% increase in watch time. | Specific, visually compelling details captured viewer attention better than generic images. |
| Gaming Channel | Standard gameplay thumbnail | Dramatic close-up of an intense moment, with dynamic text overlay | Increased visual excitement and suspense to capture attention. | 18% increase in click-through rate, 12% increase in subscriber growth. | High-impact visuals, emphasizing excitement and key moments, are effective for engaging viewers. |
| Educational Channel | Simple, text-heavy thumbnail | Image with a person interacting with the topic, a question overlay | Showed a relatable and active learner rather than a passive observer, which sparked curiosity. | 20% increase in click-through rate, 10% increase in video completion rates. | Creating a relatable image of learning and asking questions within the thumbnail encouraged viewers to engage. |
Successful Thumbnail Designs
Effective thumbnails often use high-quality images, compelling visuals, and clear, concise text. Successful designs create a strong visual narrative, sparking curiosity and enticing viewers to click.
- High-Quality Images: Using professional-quality images or well-edited screen grabs often enhances the overall look and feel of the thumbnail, increasing visual appeal. A crisp image conveys professionalism and trust, encouraging engagement.
- Compelling Visuals: Intriguing elements such as close-ups, dramatic lighting, or motion graphics can create a more captivating thumbnail, prompting viewers to investigate further. Visuals should complement the content and provide a glimpse of the video’s key aspects.
- Clear and Concise Text: Using clear and concise text, including s related to the video topic, makes the thumbnail easier to understand and helps viewers quickly grasp the video’s core message. The text should be easy to read and legible against the backdrop.
Unsuccessful Thumbnail Designs and Reasons
Several factors can contribute to the failure of a thumbnail split test. Understanding these failures helps identify what not to do and how to improve thumbnail designs for greater success.
- Unclear Visuals: Vague or unclear images can leave viewers confused about the content, leading to lower click-through rates. Viewers should be able to quickly understand the essence of the video from the thumbnail.
- Inadequate Text Overlay: Using too much text or using unreadable fonts in the thumbnail overlay can be detrimental. The text should support the visual, not overwhelm it, ensuring readability and clarity.
- Mismatched Visuals: Thumbnails that don’t accurately reflect the content of the video can create mistrust and confusion among viewers, causing them to avoid the video. The thumbnail should align with the video’s theme.
Future Trends in YouTube Thumbnail Design
YouTube thumbnail design is constantly evolving, mirroring the platform’s ever-changing landscape. Keeping up with these trends is crucial for creators to maintain high click-through rates and engagement. Understanding the drivers behind these trends allows for proactive adaptation and effective split testing. This exploration dives into the emerging patterns and how data can guide future designs.The future of YouTube thumbnail design is shaped by a blend of factors: user engagement trends, platform algorithms, and the continuous innovation in visual design.
This means creators must not only understand the current trends but also anticipate and adapt to the evolving preferences of their target audience.
Emerging Trends in Visual Design
Visual appeal remains paramount. The focus is shifting towards dynamic, eye-catching visuals that capture attention quickly. This includes using high-quality images, compelling typography, and motion graphics. The trend is towards more visually stimulating, less static, thumbnails that create a sense of movement and intrigue. For example, thumbnails that showcase action or a reveal effect tend to perform better than simpler, static designs.
Emphasis on Clarity and Context
Users are increasingly discerning, requiring thumbnails to clearly communicate the video’s content and benefit. This means avoiding ambiguity and ensuring the thumbnail accurately reflects the video’s core message. Clever use of typography, icons, and concise text can effectively convey the essence of the video. Consider a thumbnail that accurately represents the main topic of the video, for example, a thumbnail that shows a person struggling with a problem in a video about problem-solving will generate better click-through rates compared to one that uses generic stock imagery.
Interactive and Engaging Thumbnails
Interactive elements are gaining traction, providing a more dynamic and engaging experience. This includes using hover effects, animations, or clickable elements within the thumbnail itself. This approach can increase user engagement and provide immediate feedback, leading to higher click-through rates. For instance, a thumbnail with a button that invites viewers to subscribe or like the video can drive greater engagement.
Data-Driven Optimization in Split Testing, Split test youtube thumbnails
Split testing should be crucial to adapting to these emerging trends. Testing different variations of thumbnails with different visual elements and styles, such as colors, fonts, and animation, can provide valuable insights. The key is to use A/B testing to identify what resonates most with the target audience. Tracking and analyzing data is paramount to understanding which design elements increase engagement and click-through rates.
For example, if one version of a thumbnail with a particular color scheme performs better than another, that data should be used to optimize future designs.
Examples of Thumbnail Designs Leveraging New Trends
Thumbnails should be more than just images; they should tell a story. For example, consider a thumbnail for a video about cooking a specific dish, showing a tantalizing close-up of the finished dish, with subtle movement in the ingredients. This not only captures attention but also suggests the content’s quality and interest. Using bold colors and high-contrast elements can also enhance the visual appeal and ensure the thumbnail stands out in the sea of other thumbnails.
Conclusion
In conclusion, mastering split testing for YouTube thumbnails is an essential strategy for maximizing viewership and engagement. By understanding the key elements, from choosing the right metrics to implementing sophisticated testing methods, you can create a data-driven approach to thumbnail design. The examples and case studies demonstrate how effective thumbnail design significantly impacts viewer behavior, leading to increased video views and a more successful YouTube channel.
This is a continuous process of refinement and optimization, as trends and audience preferences evolve. By consistently testing and adapting your thumbnails, you’ll unlock the full potential of your YouTube content.