Lighthouse Chrome Extension Your Websites Performance Hero
Lighthouse Chrome extension is your secret weapon for optimizing website performance. It provides a comprehensive suite of tools to analyze your site’s speed, accessibility, , and more, directly within your Chrome browser. This detailed guide will explore the ins and outs of this powerful extension, from installation to advanced customization, and everything in between.
From identifying performance bottlenecks to automating audits, this extension empowers developers to create faster, more accessible, and user-friendly websites. We’ll cover everything from the basics to the more complex configurations, enabling you to unlock the full potential of Lighthouse.
Introduction to Lighthouse Chrome Extension
The Lighthouse Chrome extension is a powerful auditing tool that helps web developers identify and address performance, accessibility, best practices, and issues within their websites. It provides valuable insights into how a website functions from a user’s perspective, offering actionable suggestions to improve user experience and search engine ranking.Lighthouse evaluates different aspects of a website’s performance, from loading times and resource utilization to the quality of code and accessibility features.
It meticulously examines the site’s performance across various factors, ultimately producing a comprehensive report with actionable recommendations for improvement.
Purpose and Functionalities
Lighthouse analyzes a webpage’s performance using various metrics and best practices, including performance, accessibility, best practices, and . This analysis helps identify potential problems and provides specific recommendations to improve each aspect. The extension offers comprehensive insights into website quality and performance issues.
Common Use Cases
Lighthouse is widely used by web developers for various purposes. It is instrumental in assessing and improving web page performance. Developers use it to measure loading times, identify inefficient code, and pinpoint areas for optimization. It’s also valuable for ensuring accessibility compliance, making the website usable for a wider range of users. Moreover, the recommendations provided by Lighthouse help developers optimize their websites for search engines.
Integration with Chrome Browser
The Lighthouse extension seamlessly integrates with the Chrome browser, making it easily accessible and usable. Users can initiate a Lighthouse audit directly from the browser’s developer tools. It leverages Chrome’s robust infrastructure for performance analysis and reporting, presenting results in a user-friendly format within the browser’s interface. This integration makes the auditing process efficient and readily available to web developers.
Features and Capabilities

The Lighthouse Chrome extension provides a powerful suite of tools for evaluating the performance and quality of web pages. It’s a valuable asset for web developers, designers, and professionals aiming to optimize websites for better user experience and search engine rankings. This comprehensive analysis goes beyond just basic metrics, offering insights into various aspects of web page performance.Lighthouse meticulously examines various factors, including performance, accessibility, , and progressive web app (PWA) capabilities.
It provides actionable recommendations for improvement, helping users address identified shortcomings and enhance the overall quality of their web projects.
Core Features
Lighthouse’s core functionality revolves around comprehensive audits. It examines a website’s code, assets, and functionality, offering insights into areas for optimization. This deep dive allows for a more informed approach to web development and enhancement.
Auditing Criteria
Lighthouse supports a variety of auditing criteria, allowing for a multifaceted evaluation of a website. These criteria cover various aspects of web development, from performance and accessibility to and PWA capabilities. This ensures a thorough analysis of the web page across a spectrum of important considerations.
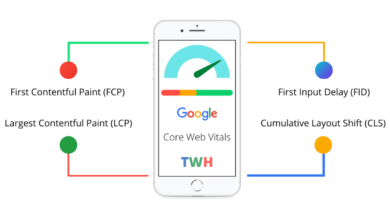
- Performance: Lighthouse meticulously examines loading times, resource utilization, and other performance-related metrics. This involves measuring factors such as First Contentful Paint (FCP), First Input Delay (FID), and Cumulative Layout Shift (CLS). For example, a slow-loading page with high CLS scores negatively impacts user experience and search engine rankings.
- Accessibility: The extension evaluates the website’s compliance with accessibility guidelines, ensuring it is usable by people with disabilities. This includes factors like proper color contrast, alternative text for images, and keyboard navigation. Meeting accessibility guidelines is not just ethically important but also legally mandated in many regions.
- : Lighthouse assesses how well the website is optimized for search engines. This involves examining factors like meta descriptions, page structure, and content quality. optimization is crucial for driving organic traffic to the website.
- PWA: Lighthouse analyzes the website’s compatibility with progressive web apps, a technology that allows websites to function like native applications. This involves examining factors like service workers, offline capabilities, and other PWA characteristics. PWAs are increasingly important for creating engaging and reliable user experiences.
Performance Metrics
Lighthouse measures a wide array of performance metrics to provide a comprehensive understanding of a web page’s speed and responsiveness. These metrics are essential for identifying areas that can be optimized to improve the user experience.
- First Contentful Paint (FCP): The time it takes for the first piece of visible content to appear on the screen. A lower FCP value indicates a faster loading experience. For example, if a website’s FCP is slow, users may become frustrated and leave before the page fully loads.
- First Input Delay (FID): The time it takes for the browser to respond to user input after the user interacts with the page. A lower FID value signifies faster interaction responsiveness. A high FID indicates potential user frustration due to delayed reactions to actions.
- Cumulative Layout Shift (CLS): Measures the amount of unexpected layout shifts that occur during the page load. A lower CLS value indicates a more stable and predictable layout, improving user experience. Unpredictable layout changes can lead to confusion and a poor user experience.
- Largest Contentful Paint (LCP): Measures the time it takes for the largest visible image or text block to load. A lower LCP score indicates that large elements load quickly. This metric is particularly important for large, image-heavy websites.
Identifying Performance Bottlenecks
Lighthouse pinpoints performance bottlenecks by analyzing various factors such as network requests, JavaScript execution time, and resource loading. It identifies the elements causing slowdowns, providing specific recommendations for optimization. This analysis provides clear insights into which components are causing performance issues and suggests potential solutions. A high number of network requests, for instance, might indicate a need to optimize image sizes or reduce the number of external scripts.
Usage and Implementation
The Lighthouse Chrome extension empowers developers to meticulously analyze web pages and identify areas for improvement. Understanding how to effectively utilize this tool is crucial for optimizing performance and enhancing user experience. This section will guide you through the installation, configuration, and practical application of the Lighthouse extension, enabling you to conduct thorough audits and interpret the results for effective implementation.Effective utilization of the Lighthouse extension requires a solid grasp of its functionality.
By following the detailed instructions provided in this section, you will be able to leverage the extension’s capabilities to conduct audits, identify potential issues, and ultimately enhance your web applications.
Installation and Configuration
To get started with Lighthouse, ensure you have the Chrome browser installed. The extension is readily available within the Chrome Web Store. Navigate to the Chrome Web Store, search for “Lighthouse,” and install the extension. Upon installation, the extension icon will be visible on your browser toolbar.
Ever used the Lighthouse Chrome extension to analyze your website’s performance? It’s a fantastic tool, but optimizing for search engines is just as crucial. A key factor in improving your site’s SEO is understanding how many links are best for a single page. Knowing this can significantly impact your search engine rankings. For a deep dive into the optimal number of links per page, check out this helpful resource: how many links should be on a page for seo.
Ultimately, using Lighthouse and understanding link strategy are both important steps in improving your site’s overall performance.
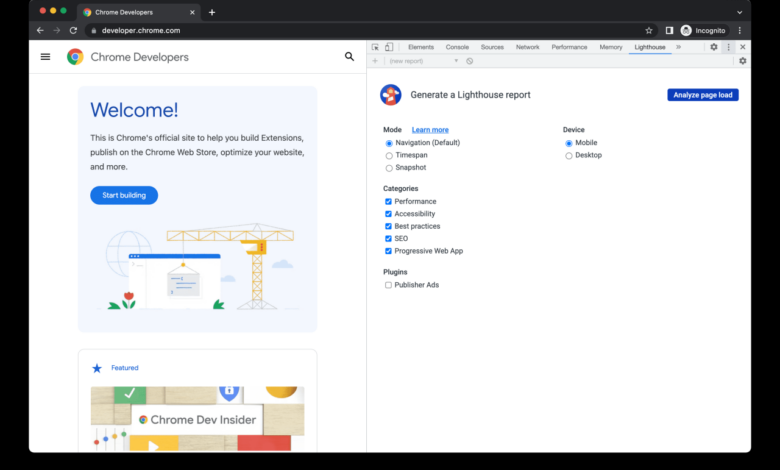
Running Audits
Once the extension is installed, launching an audit is straightforward. Open the page you wish to analyze in your Chrome browser. Click on the Lighthouse icon on the toolbar. A new tab will appear, displaying the Lighthouse audit results.To initiate an audit, select the desired performance metrics. This selection determines the specific areas of focus for the audit.
Options such as performance, accessibility, , and best practices are usually available. You can also customize the audit parameters to tailor the analysis to your specific requirements.
Interpreting Audit Results
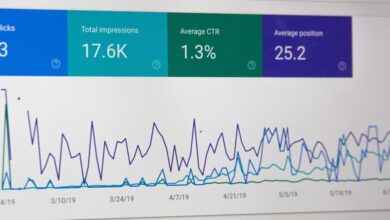
Lighthouse provides a comprehensive report detailing the performance metrics and potential areas for improvement. The report is structured to present the results in a clear and organized manner, making it easy for you to identify key performance indicators (KPIs) and areas needing attention.The results are typically presented with scores and detailed explanations. Scores provide a quick overview of the performance, while the explanations offer a deeper understanding of the issues identified.
Pay close attention to the performance metrics that are critical to your web application. Review the details of each metric to understand the specific areas needing improvement.
Lighthouse, that handy Chrome extension, helps you analyze your web page’s performance. But, understanding how to use that data effectively requires a grasp of UX/UI principles. Knowing how users interact with your site is key, and that’s where UX/UI marketing explained comes in. By diving deeper into user experience and interface design, you can use Lighthouse’s insights to make even better webpages.
Using the Extension for Specific Needs
Lighthouse offers flexibility in tailoring audits to specific needs. You can use the extension for various tasks, such as:
- Performance Optimization: Identify and address bottlenecks in page load times, optimize images, and reduce unnecessary HTTP requests.
- Accessibility Evaluation: Ensure your web pages adhere to accessibility standards, making them usable for individuals with disabilities.
- Enhancement: Improve the aspects of your web pages to enhance search engine visibility and organic traffic.
- Best Practices Adherence: Review your web page to ensure it complies with best practices and industry standards.
By understanding the specific use cases, you can utilize Lighthouse for more tailored analyses and optimizations.
Common Errors and Fixes
| Error | Description | Solution |
|---|---|---|
| Network Errors | The audit fails to connect to the network during the analysis process. | Ensure a stable and reliable internet connection. Check for any network interruptions or issues that might hinder the audit. |
| Page Load Issues | The audit encounters problems loading the page being analyzed. | Verify that the target page is accessible and functional. Check for potential errors in the page’s code or content. Ensure that the site’s resources (images, scripts) are properly loaded. |
| Resource Issues | Issues encountered while accessing external resources required for the audit. | Check the accessibility of the resources and their functionality. Confirm that the resources are available and accessible, including any external scripts or stylesheets. |
Integration with Development Workflow
Lighthouse is a powerful tool, but its true potential shines when integrated seamlessly into your development workflow. This allows for consistent quality checks throughout the development process, catching performance issues early and preventing regressions. This streamlined approach not only improves website quality but also saves time and resources in the long run.By embedding Lighthouse audits into your development pipeline, you can proactively identify and address performance bottlenecks before they impact user experience.
This proactive approach fosters a culture of continuous improvement, leading to a higher quality product.
Establishing a Development Workflow
A robust workflow ensures Lighthouse audits are incorporated seamlessly into your development process. This approach allows you to identify and fix performance issues early on, avoiding costly fixes later in the development cycle.A well-defined workflow integrates Lighthouse audits into code review processes, ensuring quality standards are maintained throughout development.
Best Practices for Using the Extension
Following best practices ensures consistent and reliable Lighthouse audits. This approach maximizes the utility of the extension and minimizes potential errors.
- Thorough Audit Selection: Choose audits relevant to your project’s specific needs. For instance, if you’re focused on mobile performance, prioritize mobile-specific audits.
- Consistent Reporting: Establish clear reporting mechanisms to track and analyze Lighthouse results over time. This allows you to identify trends and areas needing consistent improvement.
- Regular Audits: Schedule regular audits during development sprints or as part of code review processes. This allows for early detection of performance issues.
- Contextualization: Understand the context of the audit results. Don’t just look at scores; delve into the specific issues identified by Lighthouse. Analyze the impact of the issues on the user experience and design strategies to address them.
Automating Audits
Automating audits is crucial for maintaining consistent website performance. This process saves time and ensures that audits are run automatically without manual intervention.
- CI/CD Integration: Integrate Lighthouse audits into your Continuous Integration/Continuous Delivery (CI/CD) pipeline. This allows for automated performance checks at each stage of the development process. For example, a build failure could be triggered if performance thresholds are not met.
- Command-line Tools: Utilize command-line tools like `lighthouse` to automate audits. This can be integrated into scripts for automated testing and reporting.
- Scheduled Tasks: Schedule automated audits using task schedulers like `cron` to run checks on a regular basis, monitoring performance over time.
Optimizing for Different Devices
Lighthouse assists in optimizing websites for diverse devices. This is crucial for ensuring a positive user experience across various screen sizes and resolutions.
- Mobile-First Approach: Conduct mobile-specific audits using Lighthouse to identify potential performance issues on smaller screens. This is particularly important given the increasing use of mobile devices.
- Desktop Optimization: Conduct desktop-specific audits to ensure performance is optimized for larger screens. This can involve different strategies to address the performance needs of desktop users.
- Responsive Design: Use Lighthouse to assess how well your website adapts to different screen sizes. The audits help in understanding the strengths and weaknesses of your responsive design, identifying areas for improvement.
Workflow Diagram
The following diagram illustrates the stages of using the Lighthouse Chrome extension in a development workflow:
| Stage | Description |
|---|---|
| 1. Code Implementation | Develop the website or application. |
| 2. Audit Initiation | Trigger a Lighthouse audit using the extension. |
| 3. Result Analysis | Review the audit results, focusing on specific performance metrics and areas for improvement. |
| 4. Remediation | Implement necessary changes based on the audit findings to improve performance. |
| 5. Repeat Audits | Regularly audit the site to track progress and identify further areas for improvement. |
Advanced Usage and Customization
The Lighthouse Chrome extension, while offering a comprehensive suite of audits, provides avenues for advanced customization and control. This allows users to tailor the audit process to their specific needs and workflows, enabling a more granular understanding of website performance. This section dives into these advanced features, demonstrating how to optimize audits and extract maximum value from the results.Beyond the default audits, users can leverage various advanced functionalities to fine-tune the inspection process.
This includes configuring custom audits, adapting audit parameters, and incorporating specialized performance analysis strategies.
Custom Audit Configurations
Customizing Lighthouse audits allows tailoring the evaluation process to specific project requirements. This involves selecting specific metrics, adding custom scripts, or altering the weighting of existing metrics. This customization often helps in pinpointing performance bottlenecks that standard audits might overlook. For instance, a team developing an e-commerce site might want to place more emphasis on metrics related to page load time on product detail pages.
Advanced Audit Parameters
Users can adjust various parameters to refine the audit results. These parameters include the viewport size, device emulation, network conditions, and even the presence of specific browser extensions. Modifying these settings enables users to simulate different user scenarios and gain insights into performance across various conditions. For example, an audit run with a mobile viewport emulation will reveal performance issues that might be hidden during desktop audits.
Custom Audits
Creating custom audits empowers users to focus on specific aspects of their website’s performance. This involves defining custom metrics and integrating them into the Lighthouse audit framework. This could involve measuring the performance of specific JavaScript libraries, analyzing the impact of a particular CSS rule, or examining the behavior of a custom plugin. This level of control provides a highly targeted analysis for specific code sections.
Performance Improvement Strategies
Lighthouse audit results offer actionable insights for improving performance. Strategies often include optimizing images, minifying CSS and JavaScript files, reducing HTTP requests, and improving server-side response times. By meticulously analyzing the audit results, developers can identify the specific areas needing improvement and apply targeted solutions. For instance, the audit might highlight a significant amount of time spent downloading large images.
By compressing the images without sacrificing quality, page load time can be significantly reduced.
Example: Custom Audit for Image Optimization
A custom audit might be built to analyze image optimization across the website. This would involve evaluating image formats (e.g., WebP), compression levels, and the presence of responsive images. The results would then offer recommendations on improving image sizes and formats to minimize load times and improve user experience.
Comparison with Other Tools: Lighthouse Chrome Extension
Lighthouse, while a powerful tool, isn’t the only game in town when it comes to web performance analysis. Understanding its place within the broader ecosystem of performance optimization tools is key to maximizing its effectiveness. This section dives into direct comparisons with similar tools, highlighting strengths, weaknesses, and unique value propositions.Different tools cater to various needs and user profiles, from beginner-friendly audits to advanced customization options.
Choosing the right tool depends heavily on the specific project goals, available resources, and technical expertise.
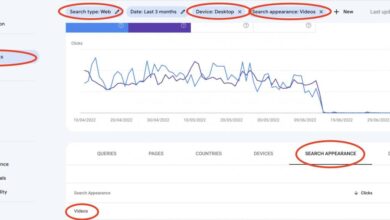
Comparison with PageSpeed Insights
PageSpeed Insights, a popular alternative, provides a quick and straightforward performance assessment. It focuses on identifying opportunities to improve page speed, primarily based on Google’s performance recommendations. Lighthouse, on the other hand, offers a more comprehensive suite of metrics, including accessibility and considerations. PageSpeed Insights is generally easier to use for quick checks, while Lighthouse provides a deeper understanding of the underlying performance factors.
Comparison with WebPageTest
WebPageTest offers in-depth, granular performance testing, simulating various user scenarios and network conditions. While providing a detailed breakdown, it lacks the holistic approach of Lighthouse, which assesses multiple factors beyond just speed. WebPageTest is valuable for meticulous testing and understanding specific bottlenecks, while Lighthouse excels at a broader performance analysis across various criteria.
Lighthouse, that handy Chrome extension, is great for checking website performance. But before you dive into optimizing your site’s speed, consider a thorough social media audit. A good social media audit helps you understand your current social media presence and identify areas needing improvement, which ultimately impacts your website’s overall performance. Then, you can use Lighthouse to fine-tune those aspects of your site to ensure it works flawlessly across all devices and platforms.
Comparison with GTmetrix, Lighthouse chrome extension
GTmetrix is a popular performance testing tool providing detailed reports on page load times and server response. Like PageSpeed Insights, GTmetrix is focused on identifying areas for improvement in loading speed. Lighthouse extends this analysis by encompassing a wider range of factors, including accessibility and implications, providing a more comprehensive view of the website’s performance. GTmetrix is generally suitable for initial evaluations, while Lighthouse offers more context-rich feedback.
Strengths and Weaknesses of the Lighthouse Chrome Extension
- Strengths: Lighthouse’s strength lies in its comprehensive audit across various performance aspects, including and accessibility. It offers a detailed breakdown of performance issues with actionable recommendations. Its open-source nature and extensive community support contribute to a constantly evolving and improving toolset.
- Weaknesses: While detailed, the analysis can be overwhelming for beginners. Some features require a deeper understanding of web development principles to effectively interpret the results.
Pros and Cons of Using Different Tools
- PageSpeed Insights: Easy to use, quick insights, but limited in depth.
- WebPageTest: Detailed, granular analysis, but lacks the holistic assessment of Lighthouse.
- GTmetrix: Quick analysis with actionable suggestions, but limited in the scope of metrics covered.
- Lighthouse: Comprehensive, multi-faceted analysis with accessibility and considerations. A good starting point for a complete performance audit.
Unique Value Proposition of the Lighthouse Chrome Extension
Lighthouse distinguishes itself by offering a holistic performance evaluation that goes beyond simple speed tests. Its comprehensive metrics, including accessibility and , provide a more nuanced understanding of a website’s overall performance and potential issues. This proactive approach empowers developers to optimize their sites for better user experience, improved search rankings, and enhanced accessibility. Its integrated nature with the Chrome browser makes it a convenient and readily available tool for developers and testers.
Troubleshooting and Support
The Lighthouse Chrome extension, while generally reliable, might encounter occasional issues. This section details common problems, troubleshooting steps, and support resources to help you resolve any difficulties. Understanding potential pitfalls and solutions can significantly enhance your experience with the extension.This section will cover common problems users encounter, along with steps to troubleshoot and resolve them, and resources for getting help with the extension.
It also includes potential error messages and their explanations.
Common Problems and Troubleshooting
Users may encounter various problems, ranging from connection issues to configuration errors. Thorough troubleshooting often involves verifying network connectivity, checking extension settings, and ensuring proper browser configurations.
- Extension not loading or activating: This can stem from various factors, including corrupted extension files, incompatible browser versions, or conflicting extensions. Verify the extension’s integrity by downloading it again from the Chrome Web Store. Ensure your browser version is compatible with the extension’s requirements. Disable any potentially conflicting extensions temporarily to rule them out as the source of the problem.
If the issue persists, clearing browser cache and cookies might help.
- Lighthouse audits failing unexpectedly: Issues with the target website, such as server errors, temporary downtime, or complex page structures, can lead to inconsistent or erroneous audit results. Check the website’s status and ensure the site is accessible and functioning properly. Try auditing the page again at a later time or on a different day to rule out temporary server issues. If the problem persists, contact the website administrator or the support team.
- Incorrect audit results: Differences in browser configurations, network conditions, or specific settings of the Lighthouse extension can result in inaccurate metrics. Ensure the settings in the extension are appropriate for the target website. Review the audit report carefully and check for any obvious discrepancies. If the discrepancy persists, try performing the audit again with different options selected within the extension.
Consult the Lighthouse documentation to understand possible sources of variation.
Potential Error Messages and Their Causes
Identifying and understanding error messages is crucial for effective troubleshooting. This section provides insight into common error messages and their potential causes.
| Error Message | Potential Cause | Troubleshooting Steps |
|---|---|---|
| “Network Error” | Problems with the network connection, server issues, or firewall restrictions. | Verify your internet connection. Check if the website is accessible in a different browser. Temporarily disable any firewalls or security software. |
| “Invalid JSON response” | The website’s response data is not in the expected JSON format, or the Lighthouse API is not working correctly. | Check the website’s response using tools like the browser’s developer tools. Verify that the website is sending data in a valid JSON format. Ensure the Lighthouse extension is up to date. |
| “Timeout Error” | The website takes too long to respond to the Lighthouse requests. | Adjust the timeout settings within the Lighthouse extension. Check for network latency. Try the audit on a different day or time. |
Support Resources
Several resources are available to assist users with troubleshooting issues.
- Chrome Extension Help Forums: Engage with other users and the extension developers in dedicated forums to discuss problems and seek solutions.
- Lighthouse Documentation: Consult the official Lighthouse documentation for detailed explanations, guides, and specific information about the extension.
- GitHub Issues: Report bugs or submit questions on the Lighthouse’s GitHub repository. This provides direct access to the development team for support and potential bug fixes.
Future Trends and Developments
The Lighthouse Chrome extension, a powerful tool for web performance analysis, is constantly evolving to meet the demands of a rapidly changing web landscape. This section explores potential future improvements, emerging technologies, and the continuous evolution of performance optimization techniques, offering a glimpse into the roadmap for future updates.Modern web applications demand more than just basic performance; they require seamless user experiences across diverse devices and network conditions.
The Lighthouse extension must adapt to these evolving requirements, incorporating emerging technologies and optimizing for complex scenarios.
Potential Future Features
The Lighthouse extension can benefit from enhancements that address emerging trends in web development. These features would improve the user experience and effectiveness of the tool.
- AI-powered insights: Future iterations could leverage AI to analyze performance data and provide more nuanced and actionable recommendations. For instance, AI could predict potential bottlenecks based on historical data and user patterns, going beyond simply identifying existing problems. This would help developers proactively address issues and optimize for future growth.
- Accessibility analysis: The extension could integrate accessibility audits into its analysis. This would enable developers to identify and address issues related to website usability for users with disabilities. For example, the extension could check for proper use of ARIA attributes or alternative text for images.
- Server-side performance analysis: Extending Lighthouse’s scope to analyze server-side performance would provide a more holistic view of the user experience. Tools for analyzing API responses, database queries, and server-side processing could be integrated to offer a comprehensive performance report.
- Integration with CI/CD pipelines: Lighthouse could seamlessly integrate with Continuous Integration and Continuous Deployment (CI/CD) pipelines. This would automate performance testing and feedback loops, allowing developers to incorporate performance optimization into their development workflow. This would improve the quality and consistency of performance across all deployed versions.
Evolution of Performance Optimization Techniques
Performance optimization is an ongoing process, constantly evolving with the introduction of new technologies and methodologies.
- Progressive Web Apps (PWAs): PWAs are becoming increasingly prevalent, and Lighthouse needs to adapt to evaluate their unique performance characteristics. This includes measuring factors like service worker performance, offline capabilities, and app shell optimization.
- WebAssembly (Wasm): The introduction of WebAssembly offers new opportunities for performance enhancement. Lighthouse could incorporate measures for performance analysis and optimization of Wasm modules, potentially showing how these modules impact overall application speed and responsiveness.
- Web Components: The adoption of web components for building complex UIs is growing. Lighthouse could include specific performance checks and best practices tailored to these components, enabling developers to optimize component interactions and rendering.
- The role of the browser: Browser performance improvements play a significant role in overall web application performance. Lighthouse should consider the implications of new browser features and improvements on performance results and recommendations.
Potential Roadmap for Future Updates
The evolution of the Lighthouse extension will likely involve a gradual incorporation of new features and improvements.
- Phase 1 (Near Term): Focus on integrating AI-powered insights and accessibility analysis features into the existing framework.
- Phase 2 (Mid-Term): Expansion to cover server-side performance and integration with CI/CD pipelines. This would add a holistic view of the entire application lifecycle.
- Phase 3 (Long Term): Explore and incorporate performance analysis capabilities for emerging technologies like PWAs and WebAssembly. This includes measuring and reporting on specific features related to these technologies.
Outcome Summary
In conclusion, the Lighthouse Chrome extension is an invaluable tool for any web developer or designer seeking to enhance website performance. By understanding its features, implementing best practices, and staying updated on the latest developments, you can use this extension to deliver a superior user experience. This detailed exploration has covered everything from fundamental concepts to advanced strategies, leaving you equipped to leverage Lighthouse for optimal results.